Overview
The Canvas is the main workspace for each project at app.odac.run. Use it to move around your project board, arrange app cards on the grid, and check live health and resource summaries at a glance.
Explore the workspace
- Use the top header to switch projects and access account tools. On the left, the ODAC logo and active project name open the project menu on hover or click, where you can switch projects, jump to a project's settings, or create a new one: see Projects and navigation. On the right, click Feedback to send comments or screenshots, click the numbered package icon when it appears to assign detected server apps to a project (see Assign unassigned apps to a project), or click your avatar to open Profile, Servers, Referral Codes, or Log Out.

- Use the left sidebar rail to launch apps or switch between project sections. Hover over any icon to see its label. On the Canvas, the top plus icon is Add App and opens the app launcher; on other project pages it changes to Canvas so you can return to the board. Below it are Domains, DNS Settings, Mail Accounts, and Project Settings at the bottom.
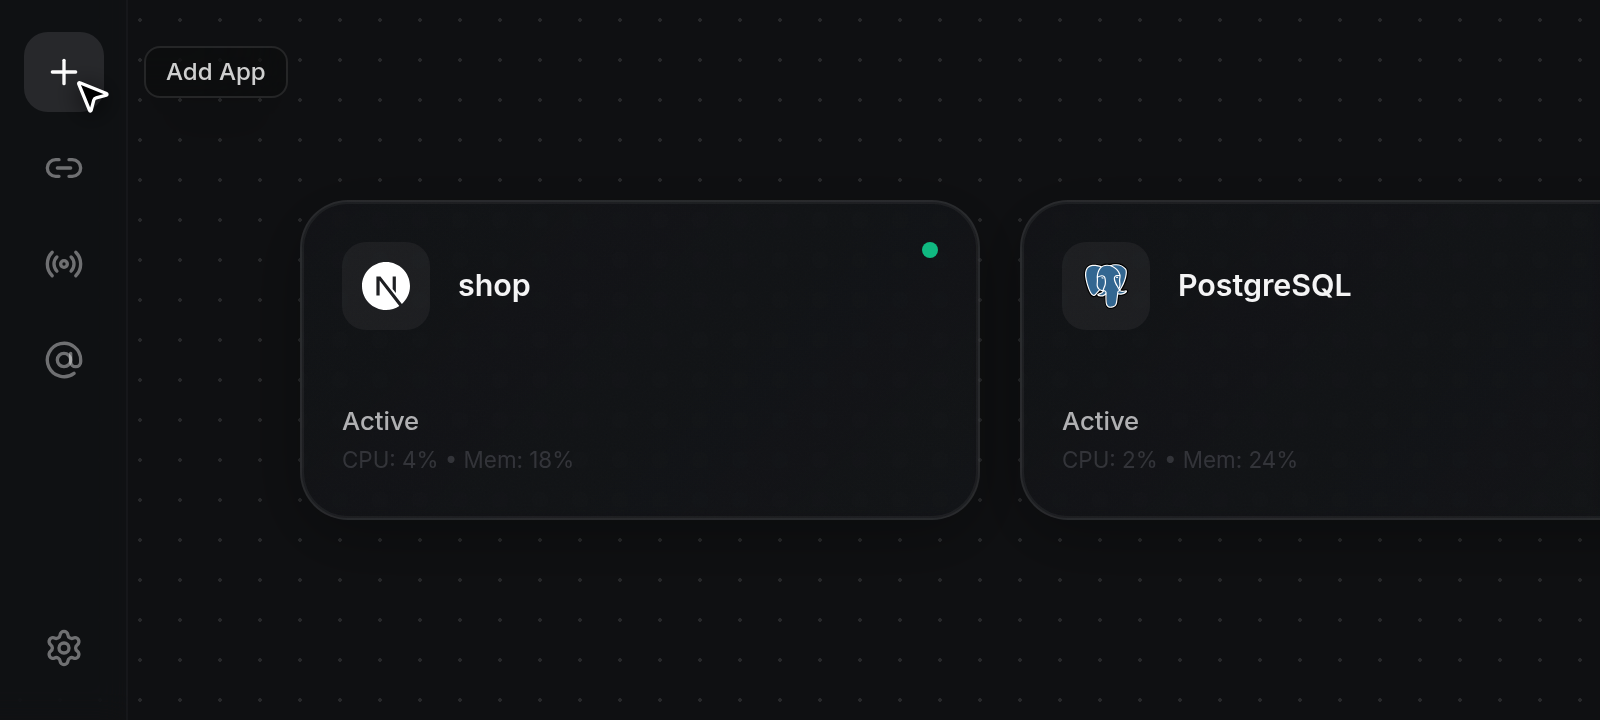
- Click the floating plus button at the bottom center of the board to open the app launcher and add apps to the project: see Browse and deploy from the launcher. If your project does not have a server attached yet, this area expands into a connect panel instead (see Queueing apps before connecting a server). If the attached server goes offline, the button changes to a Server Offline pill and new apps cannot be added until the server reconnects.

Pan and zoom the board
- Click and hold any empty spot on the dotted grid, then drag in any direction to pan across the workspace. On a touch screen, drag empty space with one finger. Clicking empty space without dragging closes the right-hand app inspector if it is open, and double-clicking empty space opens the app launcher when the server is online.
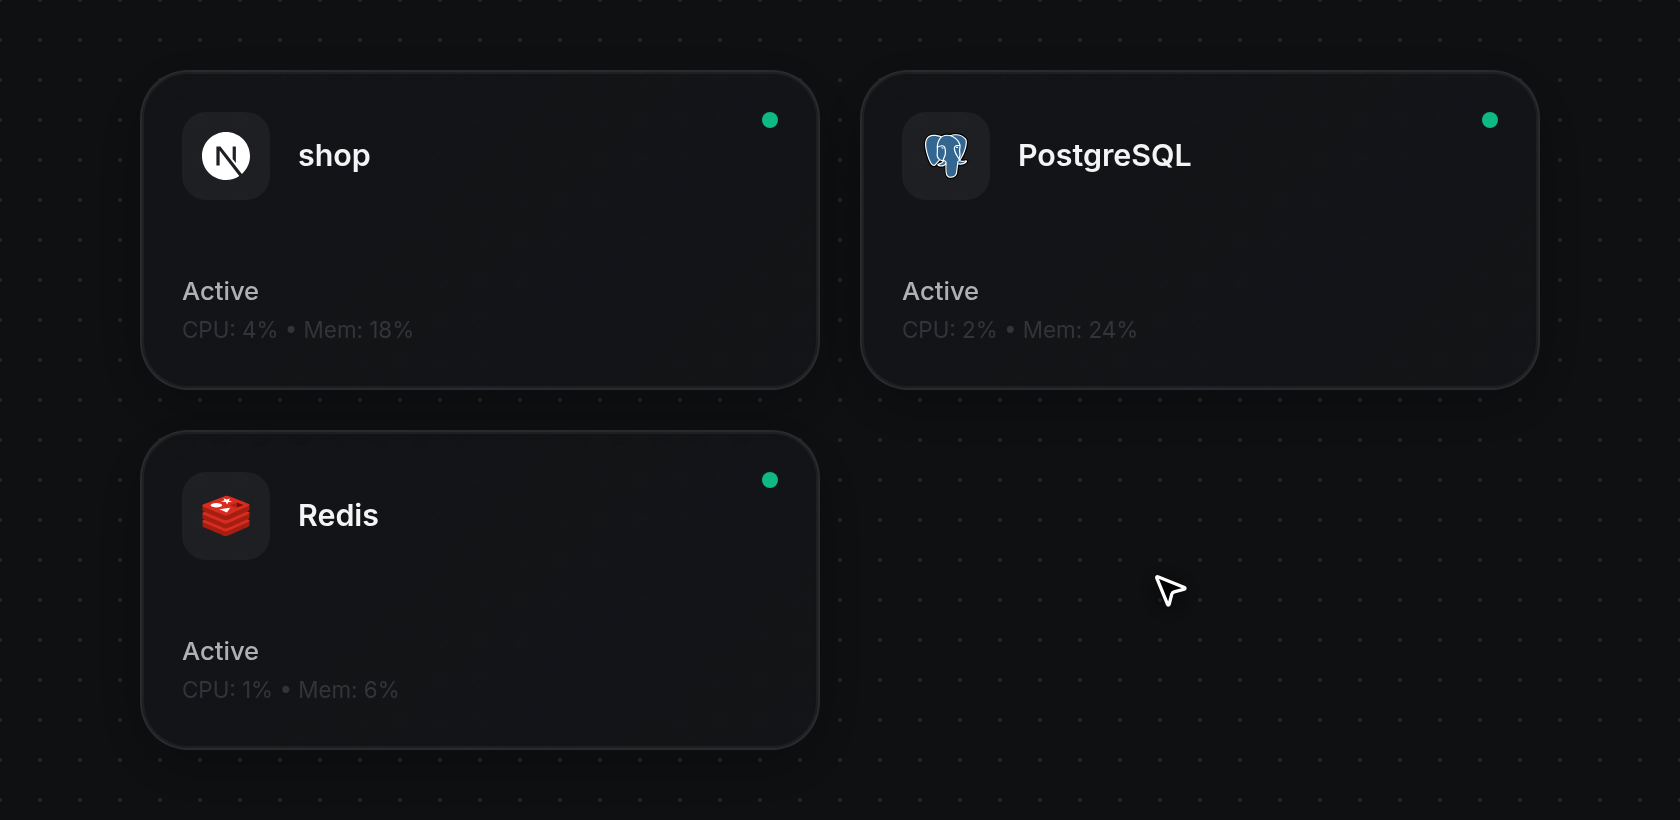
- Scroll your mouse wheel or trackpad up to zoom in around your pointer, or scroll down to zoom out. On a touch screen, pinch with two fingers to zoom in or out around the center of your pinch.
Arrange app cards on the grid
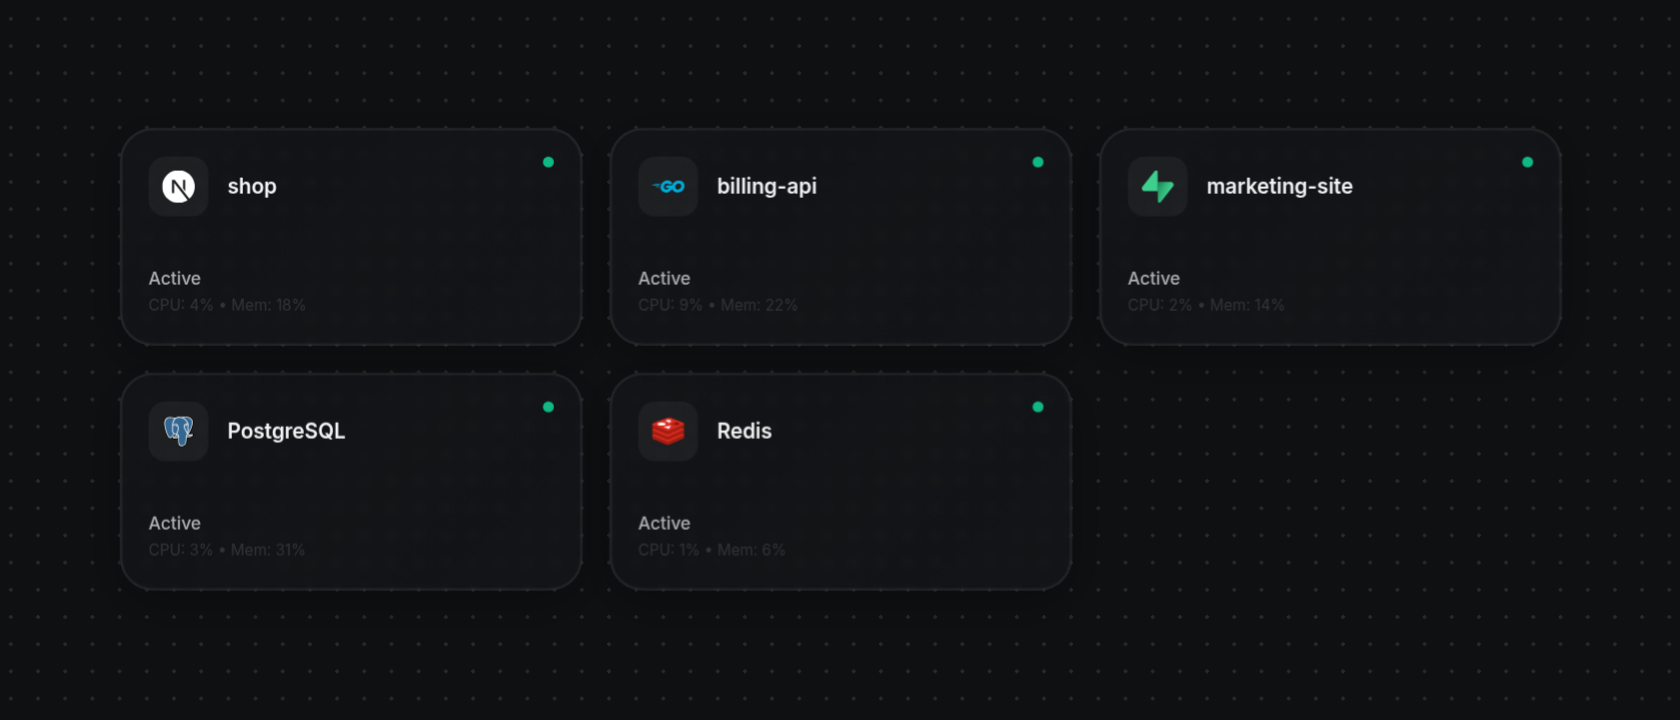
- Drag any app card to move it to a new spot on the dotted grid, then release to snap it into alignment. Clicking a card without dragging opens its details drawer on the right: see Inspect, rename, restart, and delete an app.
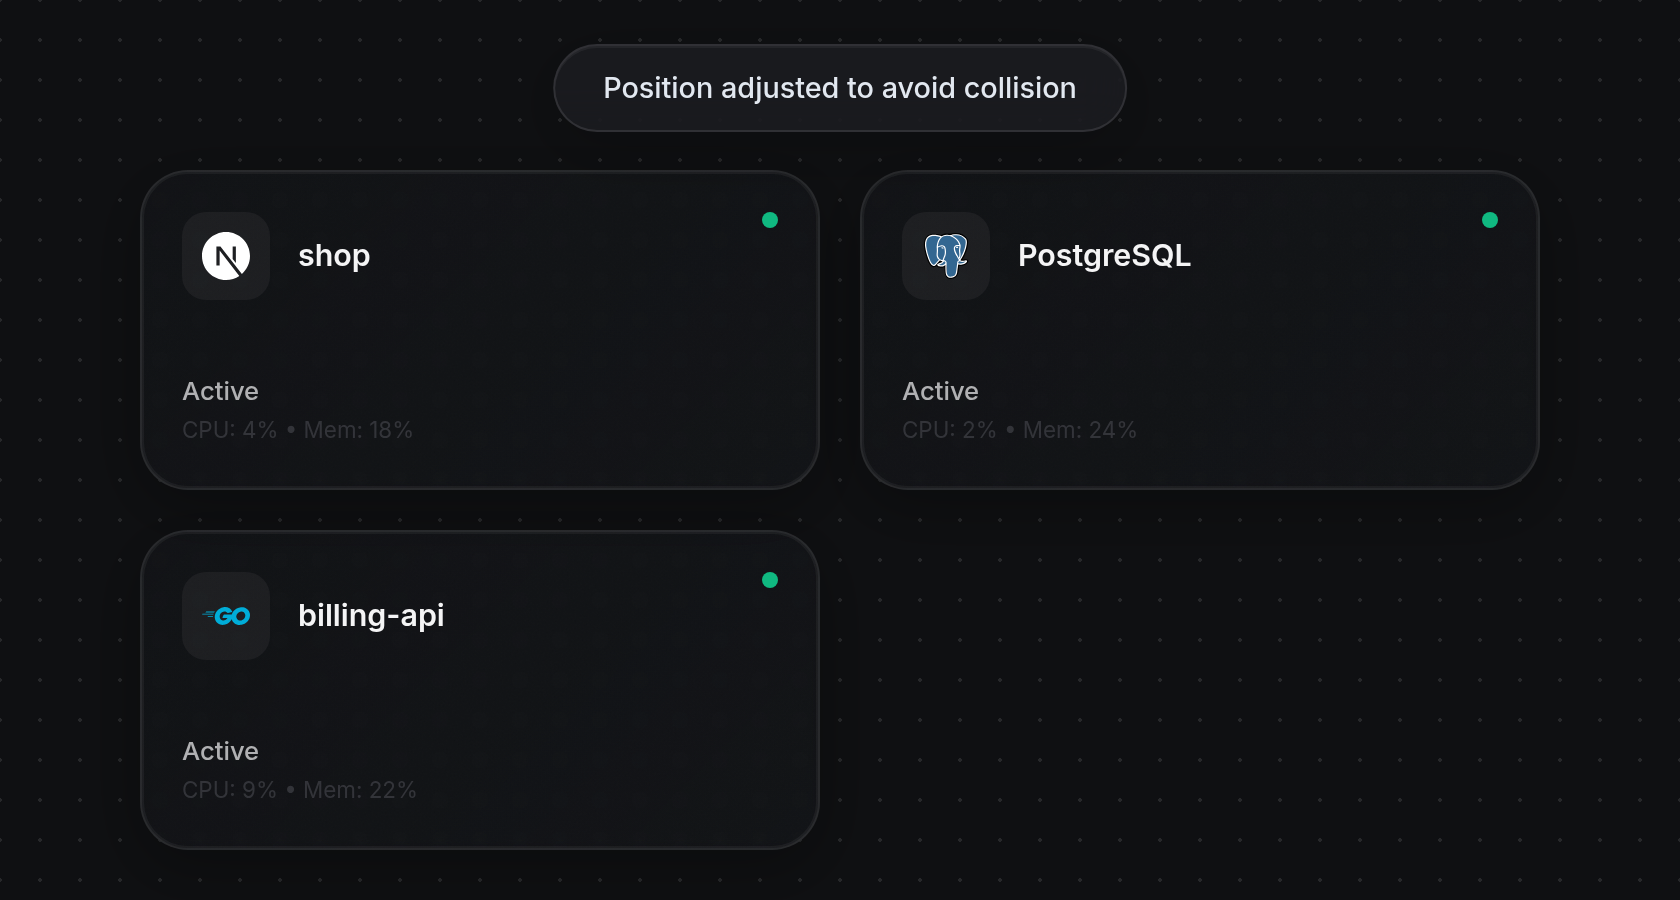
- Drop a card onto cells already occupied by another card and ODAC automatically shifts it to the nearest open spot so cards never overlap, displaying the
Position adjusted to avoid collisionnotification at the top of the screen.
Read card status and live metrics
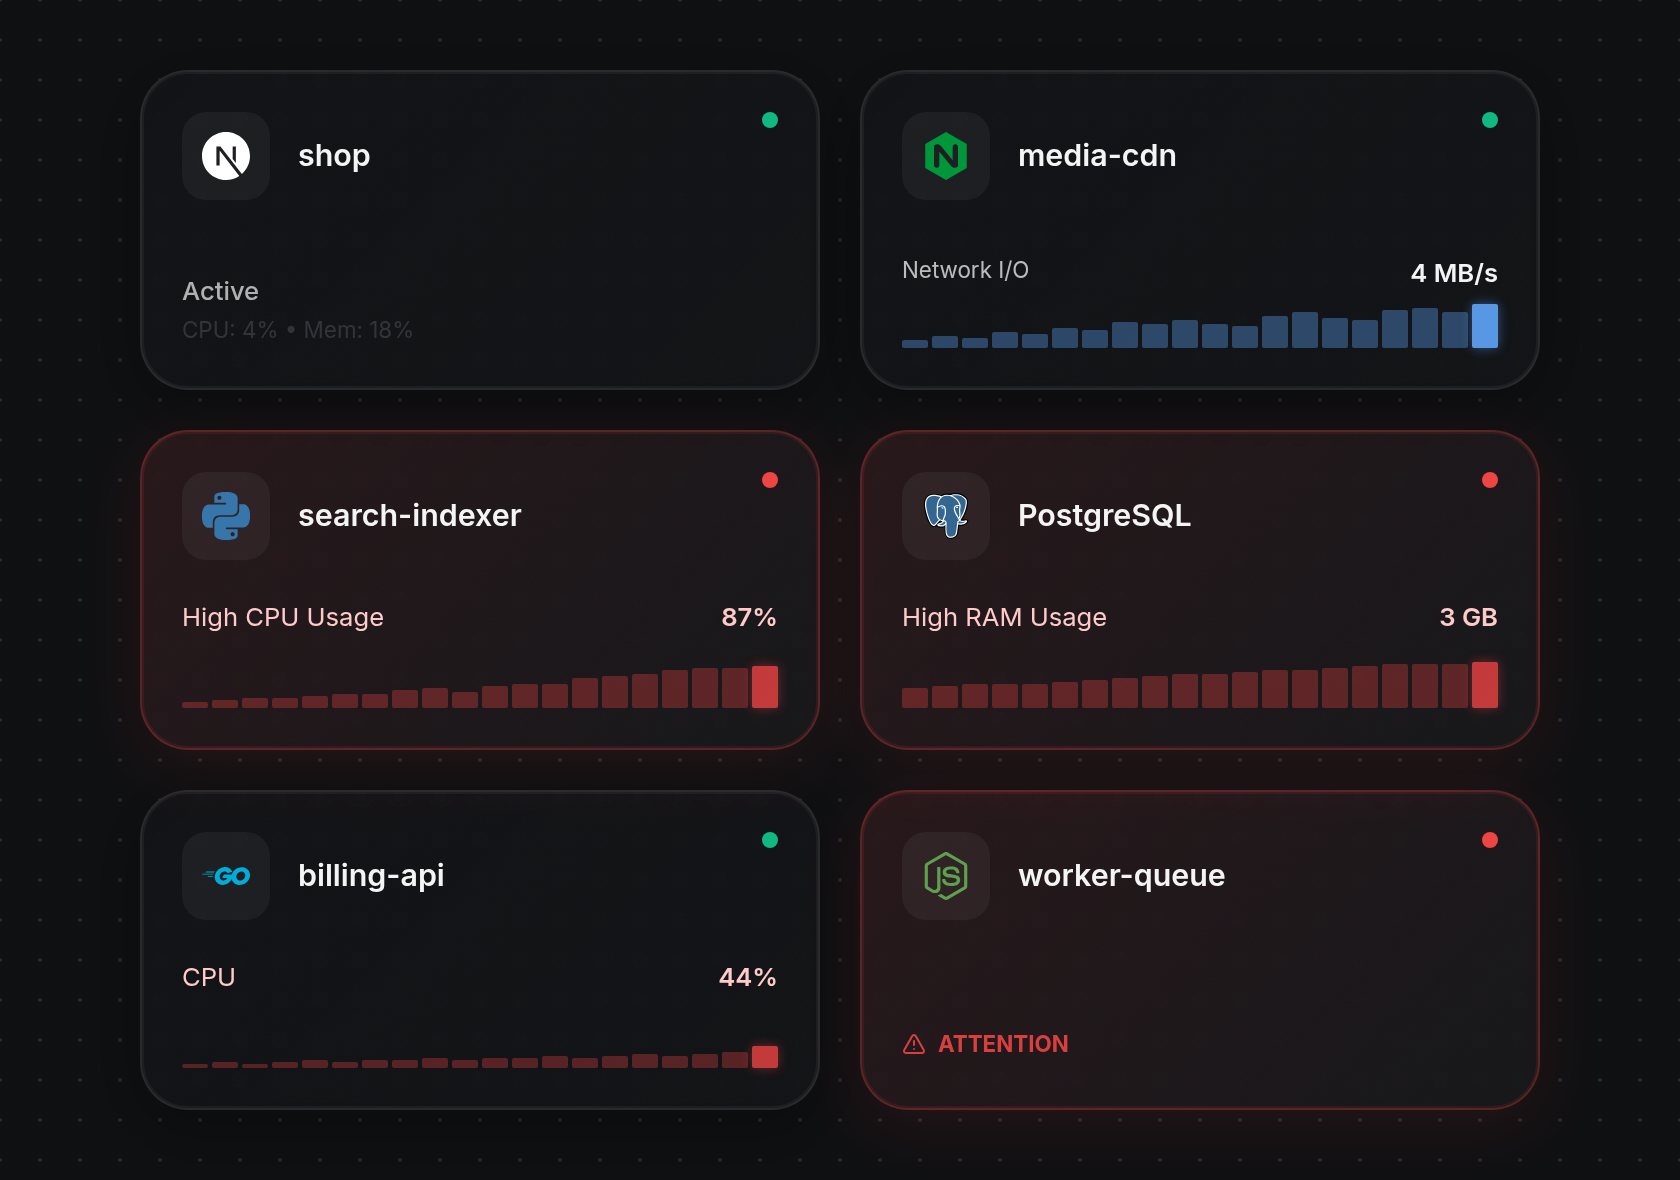
Check the status dot in the top-right corner of each card to see its current state:
- Green: the app is running normally.
- Yellow (pulsing): the app is starting, restarting, or redeploying.
- Red: the app has exited, stopped, or hit an error, and the card takes on a red tint.
- Gray: the app is
QUEUED, its status is unavailable, or the server is offline (when offline, live metric summaries at the bottom of cards are hidden).
Cards that are actively building or deploying appear dimmed with a spinner and
Creating...,Installing..., orRedeploying...; click one to open its Build Logs directly (see Read build and runtime logs).
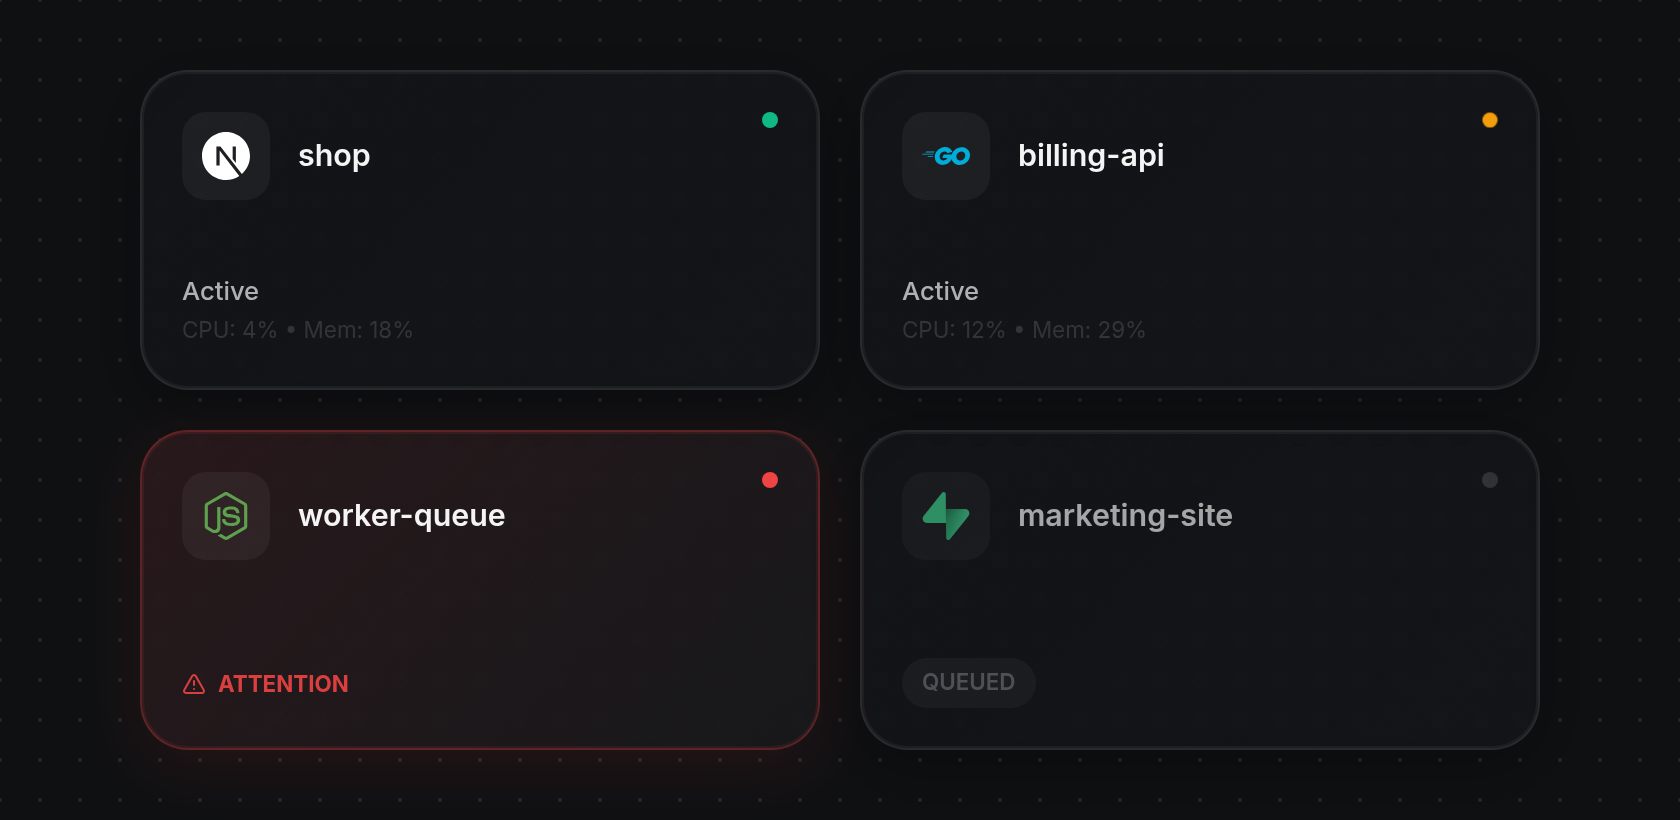
Read the bottom summary on each running card to monitor live workload and alerts at a glance:
Active: normal operation, showing currentCPUandMempercentages.High CPU UsageorCPU: appears when CPU load crosses high thresholds or hits a 20-hour peak, showing the live percentage and a 20-bar red graph with the newest bar on the right.High RAM UsageorRAM: appears when memory usage is high or peaks, showing the current memory size and a 20-bar red graph.Network I/OorNetwork: appears during heavy or peak network traffic, showing the live throughput rate and a 20-bar blue graph.Attention: appears in red with a warning icon when an app health alert requires attention.