Open a container terminal
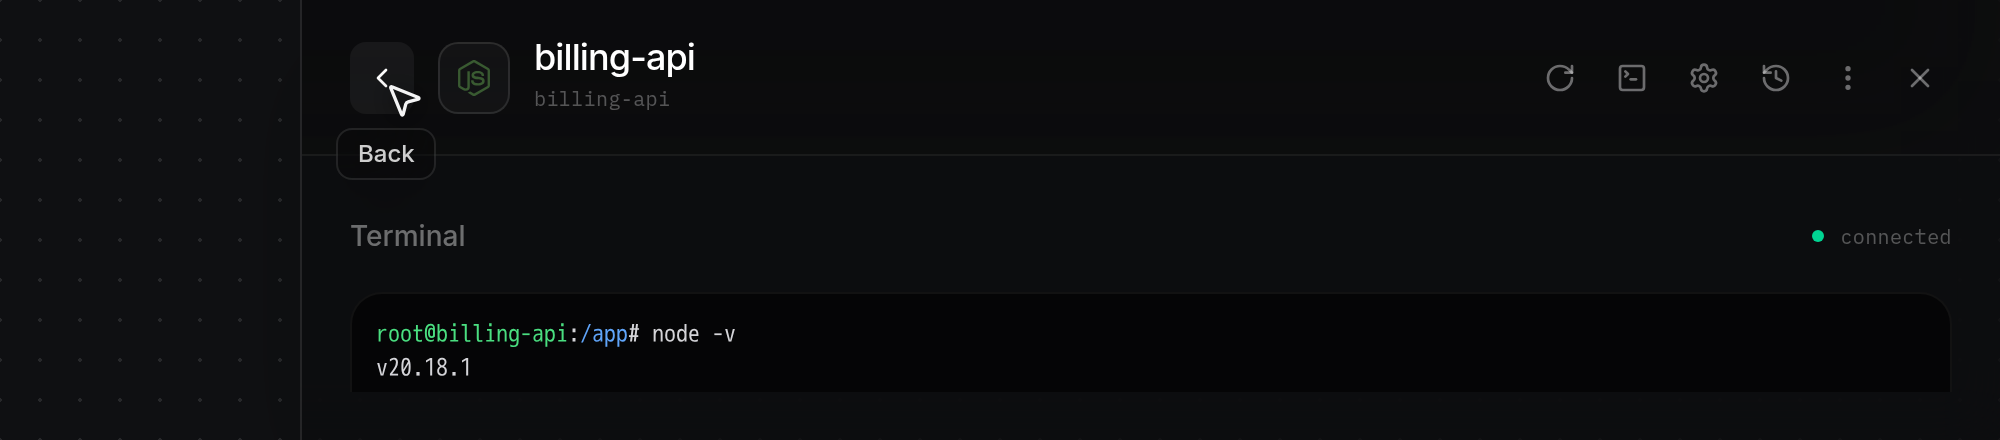
Open an interactive shell inside a running app container from the right-hand inspector on app.odac.run. From the Terminal view, you can monitor the connection status, run commands inside the container, read the exit code when a session ends, and return to the app inspector when you finish.
Open the Terminal view
- Open an app's inspector drawer from the Canvas (see Inspect, rename, restart, and delete an app), then click Terminal (the terminal prompt icon) in the inspector header.
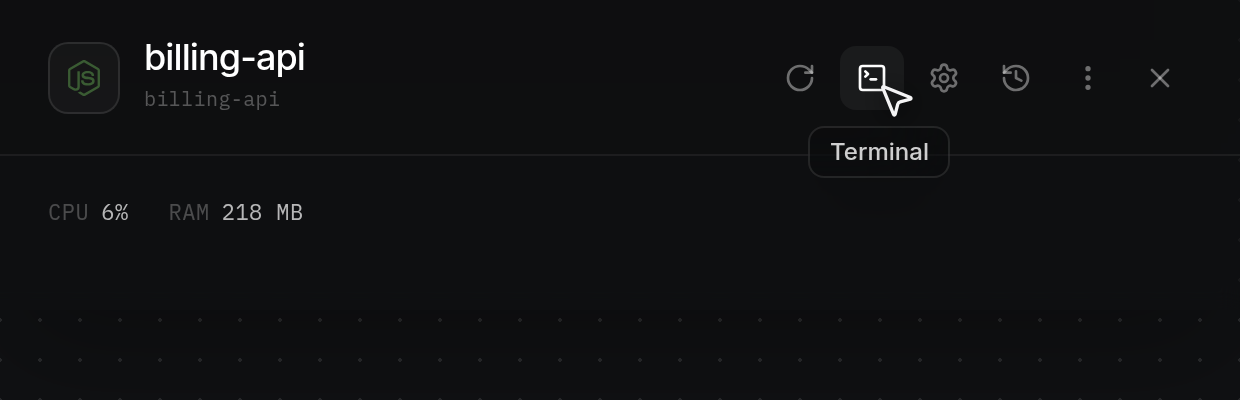
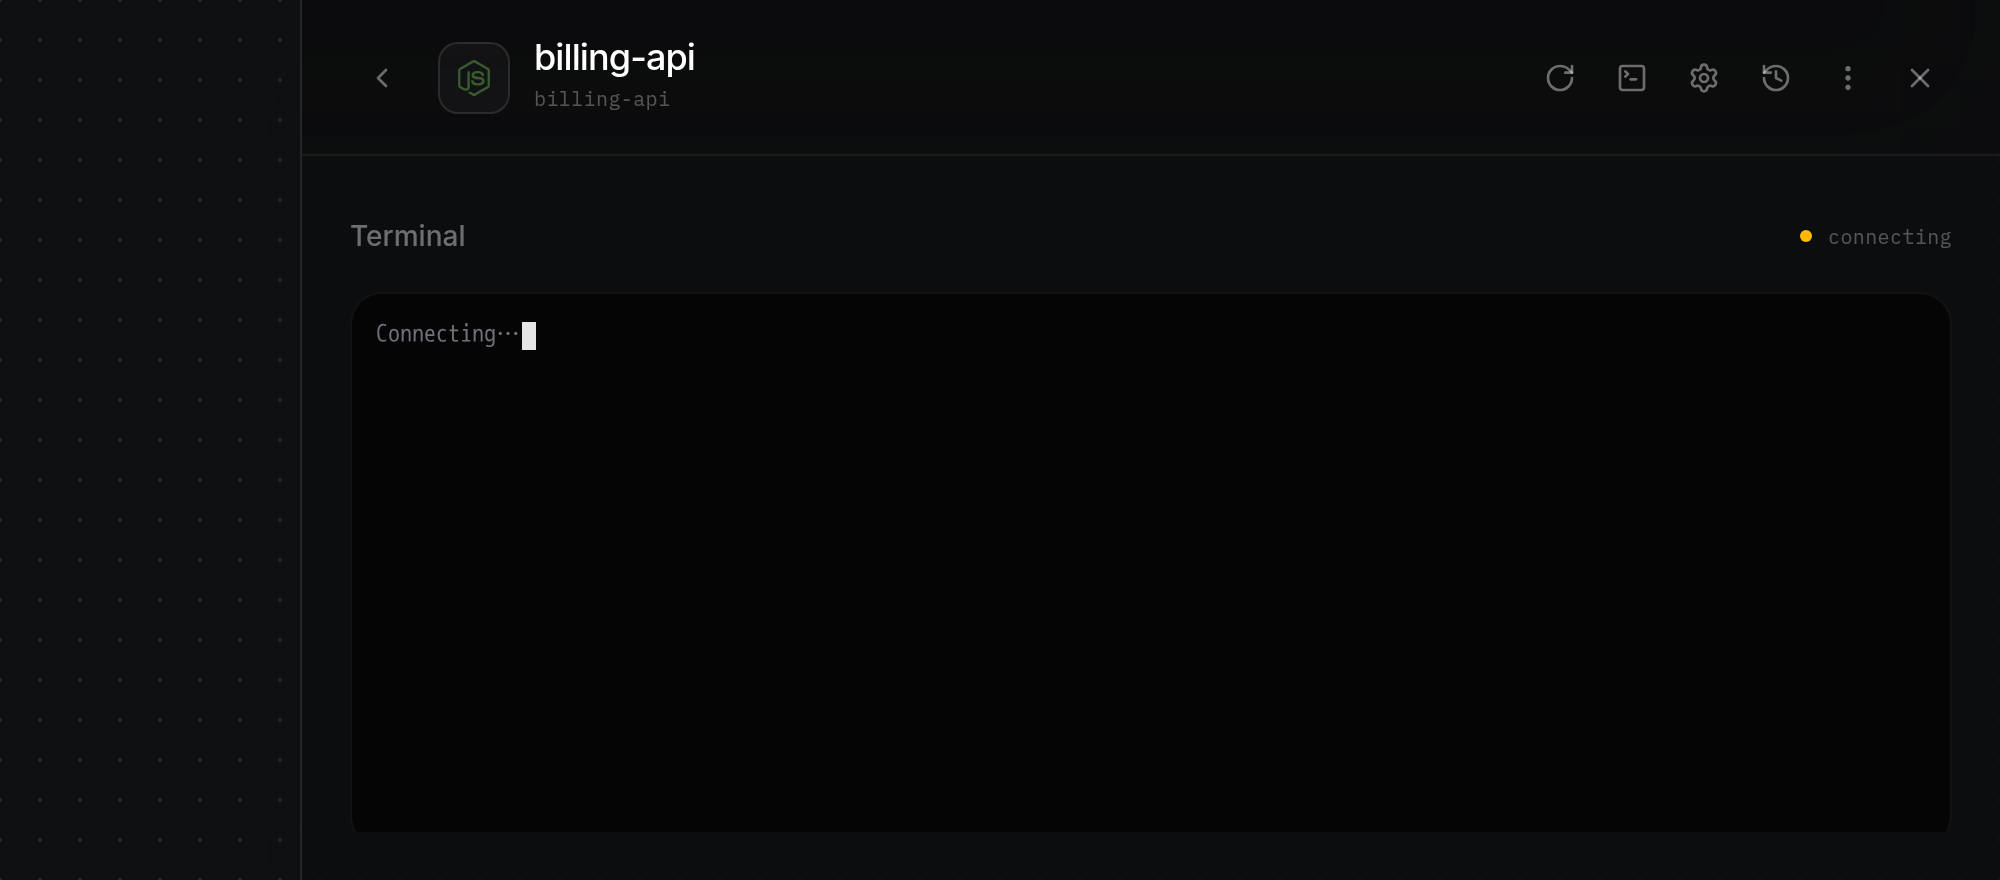
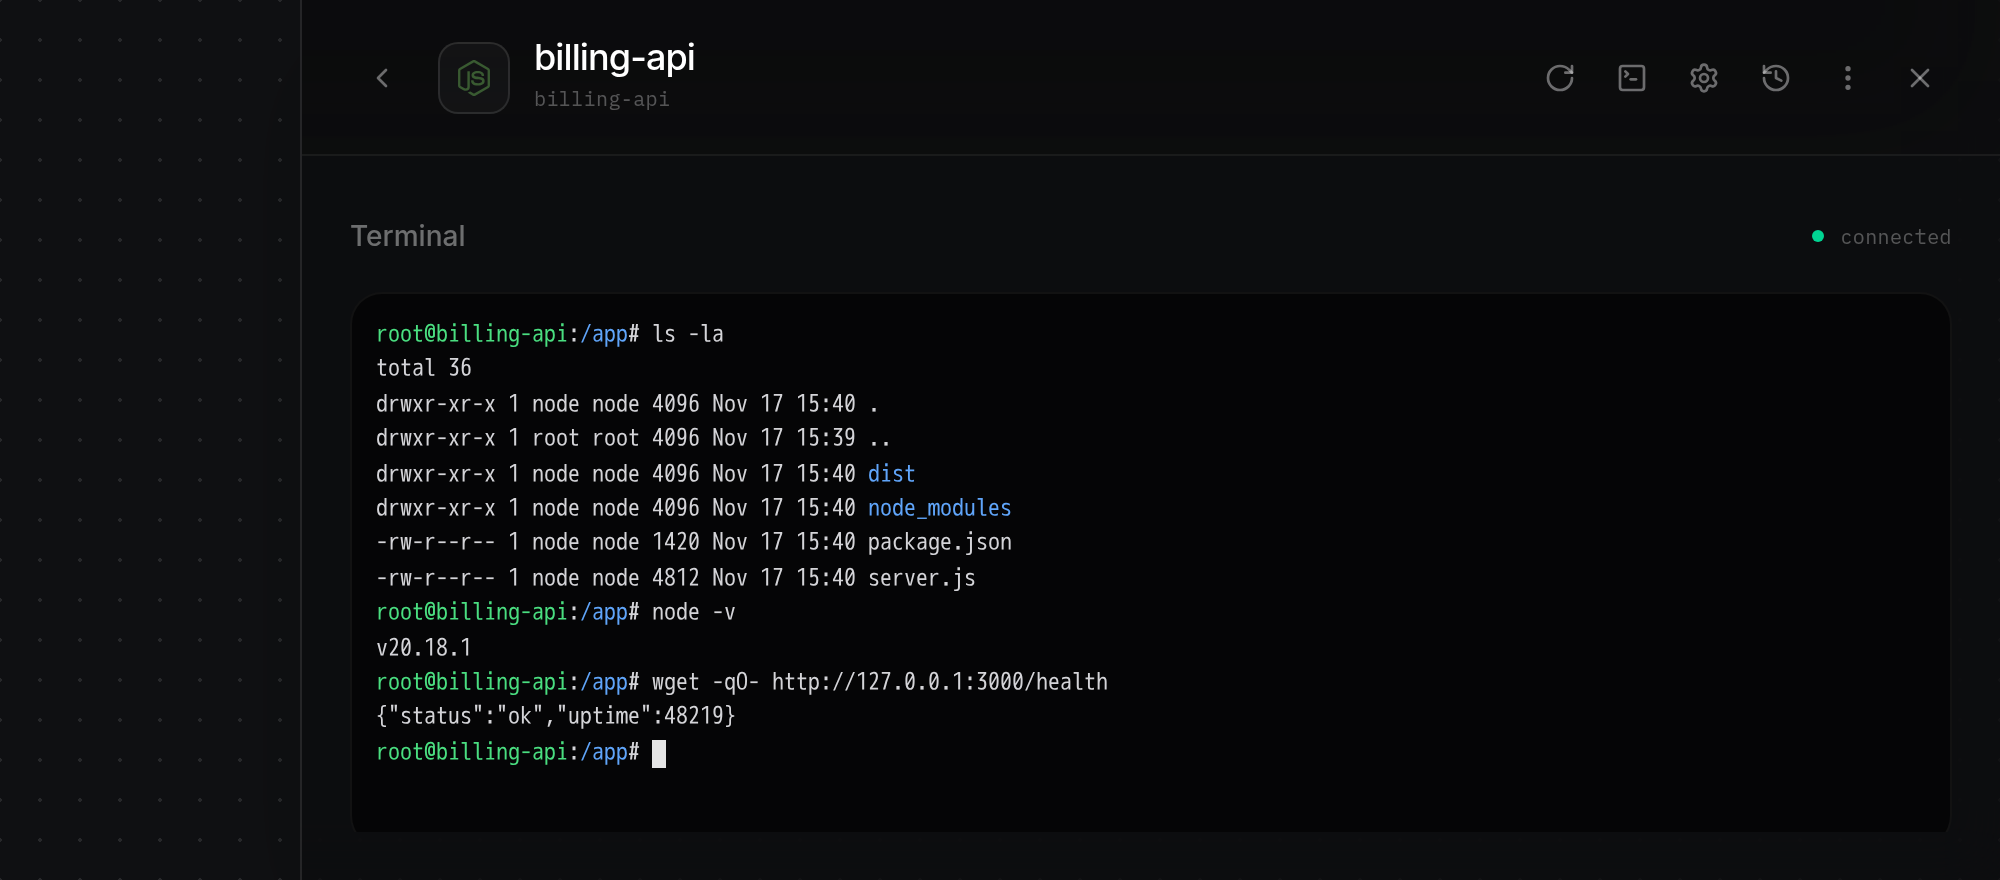
- The inspector drawer widens, collapses the overview sections out of view, and opens the Terminal panel. While the shell starts, the terminal pane shows
Connecting…and the status indicator in the top-right corner of the panel displays an amber dot besideconnecting.
Read the connection status indicator
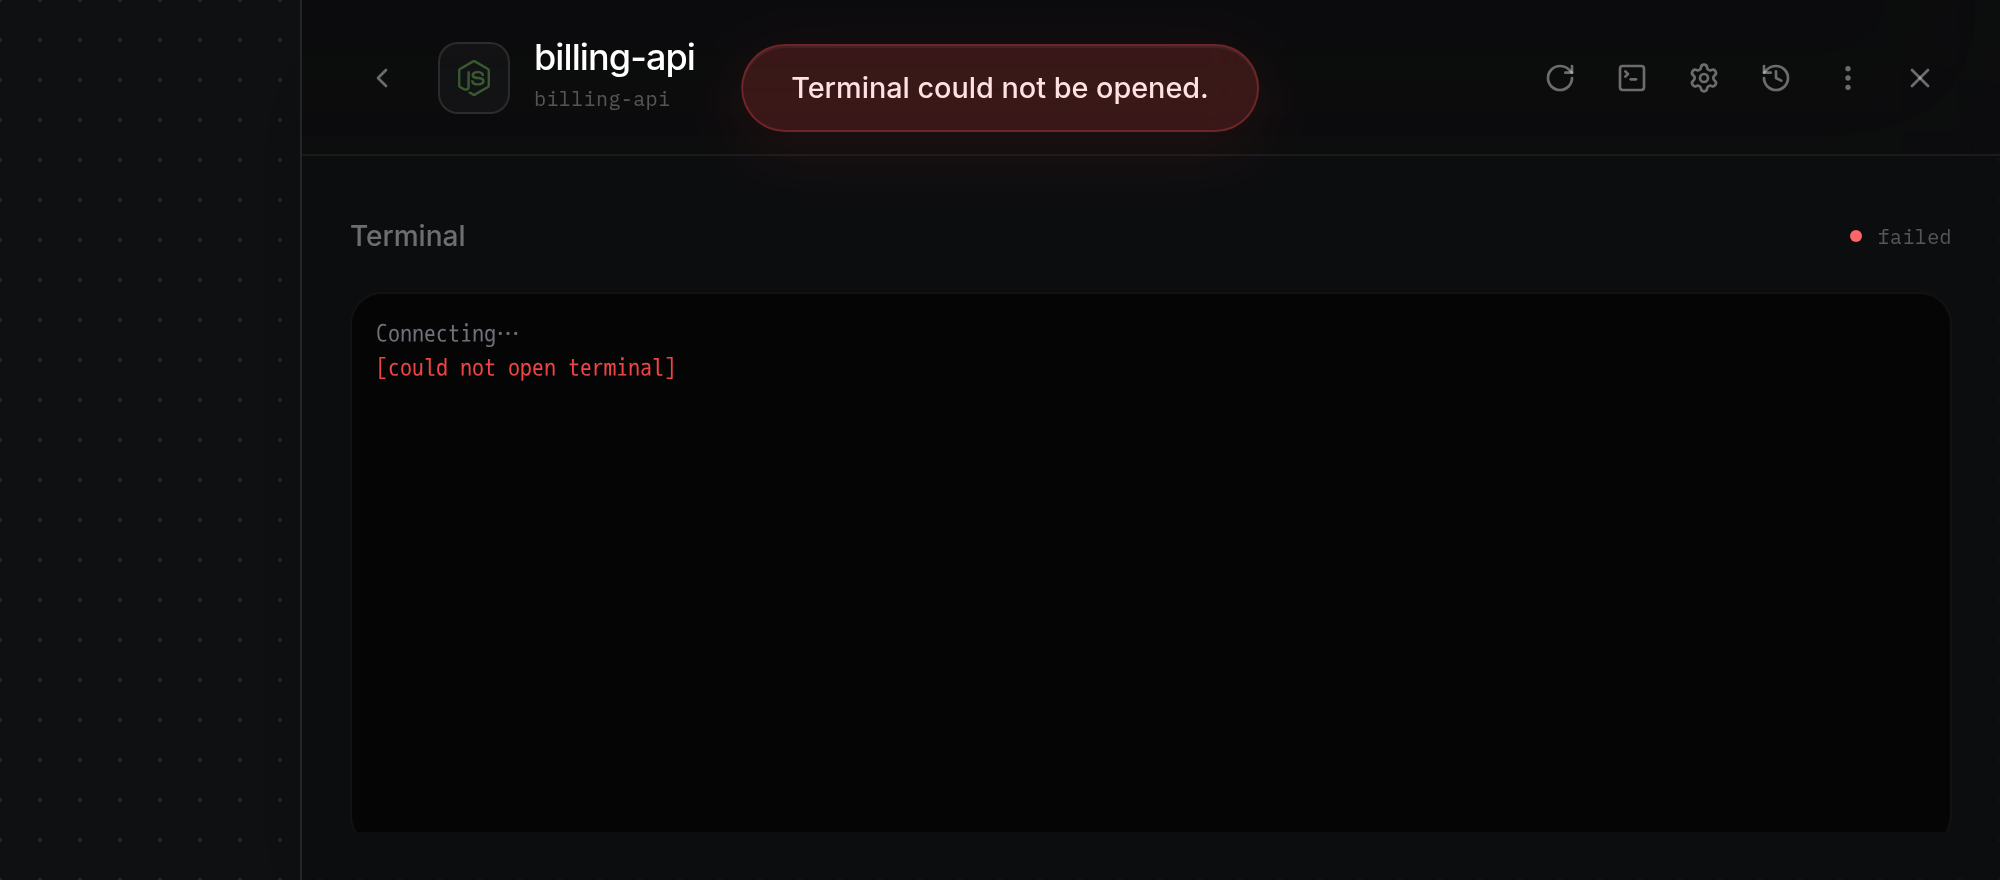
- Check the colored dot and status label in the top-right corner of the Terminal panel to follow the session state:
idle(faint gray dot) before a session starts or after it closes,connecting(amber dot) while opening the shell,connected(green dot) when ready for input,closed(gray dot) after the session ends or disconnects, andfailed(red dot) if the shell cannot open. When opening fails, the terminal pane prints [could not open terminal] in red and an error notification appears at the top of the screen (such as Terminal could not be opened., Terminal open timed out., or Server did not respond.). If the server is offline or you reach the open terminal limit, ODAC displaysServer is offline.orToo many open terminals..
Type commands in the terminal pane
- Once the indicator turns green with
connected,Connecting…clears and the terminal pane takes keyboard focus with a blinking cursor. Type commands directly into the pane and pressEnterto run them inside the container. Output streams in real time with terminal colors and up to 5,000 lines of scrollback history, and resizing your browser window adjusts the terminal dimensions automatically.
View exit status when a session ends
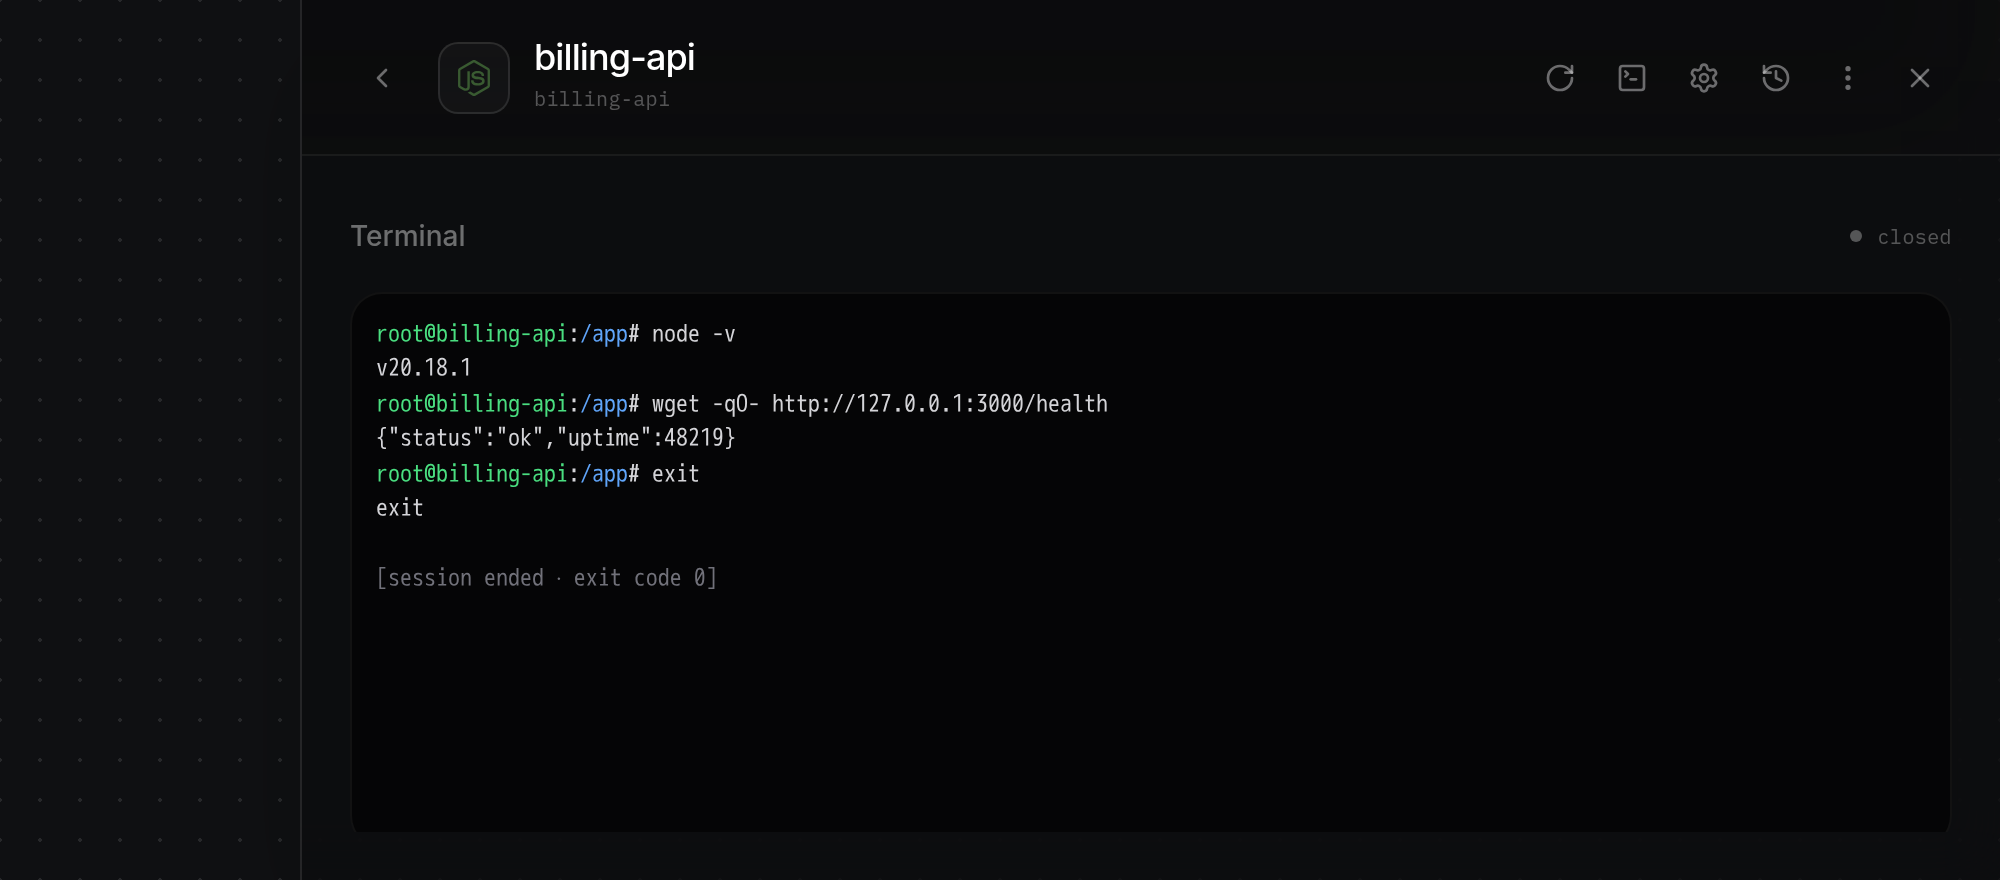
- Exit the shell by typing
exitor pressing Ctrl+D, or wait for the foreground session process to finish. The terminal pane appends [session ended · exit code 0] in gray (showing the process's actual exit code, or [session ended] when no exit code is reported), and the status indicator changes to a gray dot withclosed. Closed and failed sessions do not reconnect automatically: close and reopen the Terminal view to start a new shell.
Close the terminal view
- Click the left-chevron Back button on the left side of the inspector header (or click Terminal again) to end the active session, reset the status indicator to
idle, narrow the drawer back to its standard width, and return to the app inspector overview. You can also click Close (×), click empty space on the Canvas, or select a different app card to end the session and close or switch the inspector drawer.