View domains, tunnel usage, and uptime
Monitor every custom domain and .odac.cc tunnel attached to apps in the active project at app.odac.run. From Domains, you can check your Tunnel Usage allowance, search across domains and apps, inspect subdomain lists and visitor access modes, and expand custom domains for 24-hour and 30-day uptime history, response times, and SSL certificate expiration.
Open Domains and read Tunnel Usage
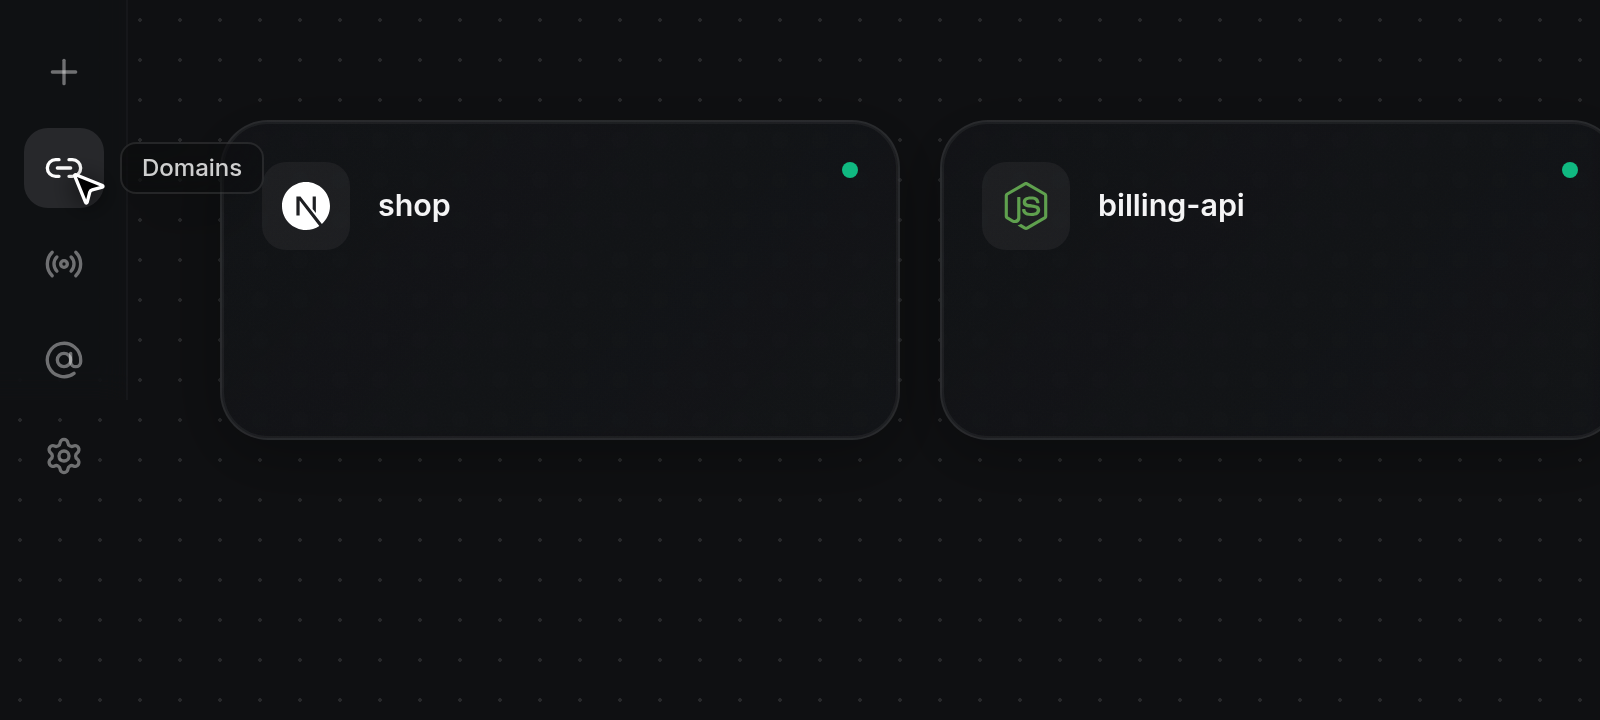
- Click the Domains link icon in the left sidebar rail on any project page. Hovering over the icon displays the
Domainslabel.
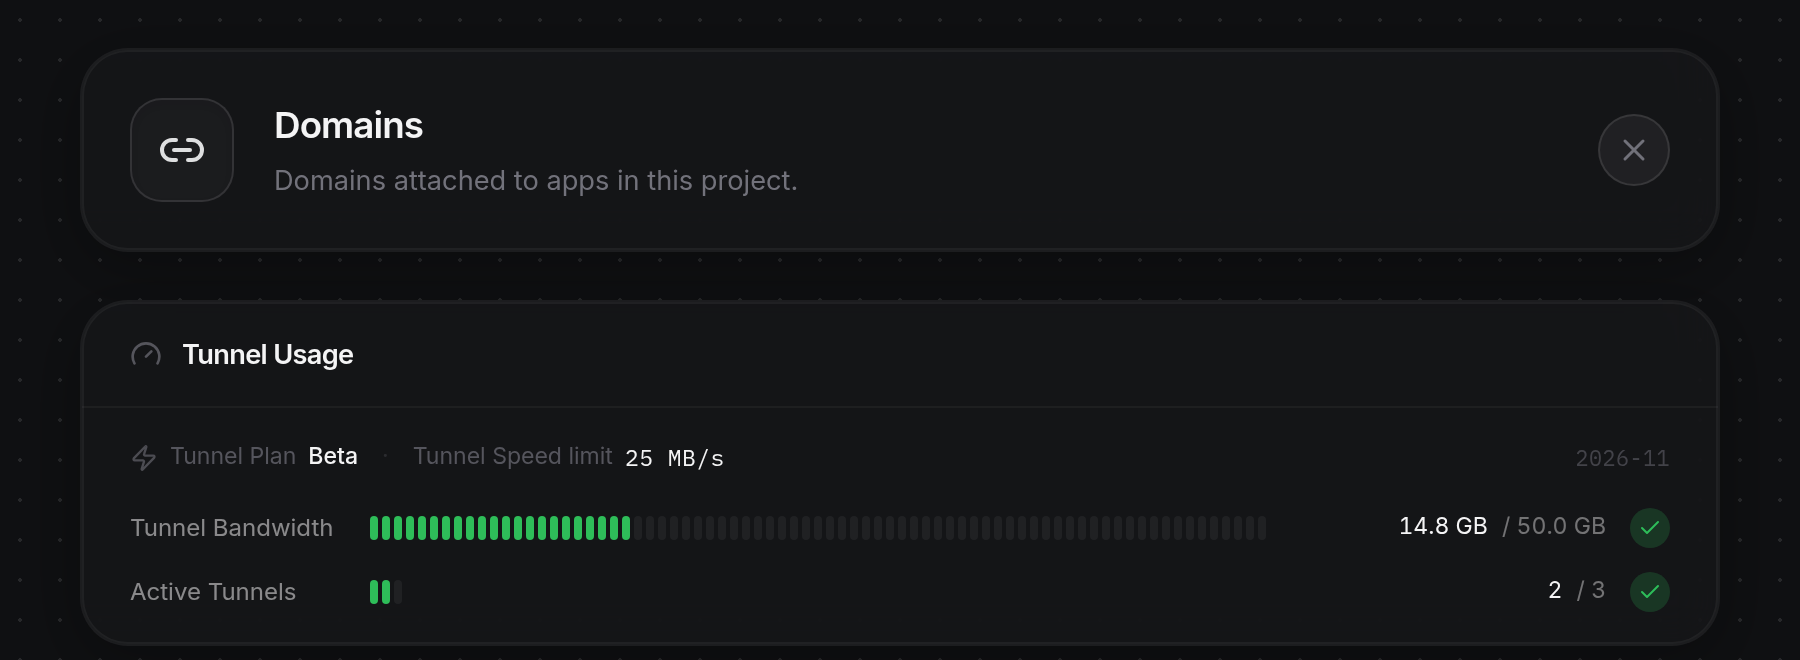
At the top of the page, the Domains header card displays
Domains attached to apps in this project.with an×button on the right to return to the Canvas. If no apps in the project have a domain or tunnel attached yet, the page showsNo domains attached to apps in this project.instead (see Attach domains and tunnels to an app).When at least one domain or tunnel exists in the project, the Tunnel Usage card appears below the header. Its summary line lists your Tunnel Plan (such as
Beta), Tunnel Speed limit (such as 25 MB/s orUnlimited), and the current billing month on the right (such as 2026-11). Below that, segmented gauges track Tunnel Bandwidth and Active Tunnels: bars fill green below 70% usage, amber from 70% to 89%, and red at 90% or above, paired with a matching checkmark, alert, or warning icon on the right (or an infinity icon when unlimited).
Search and inspect the domains list
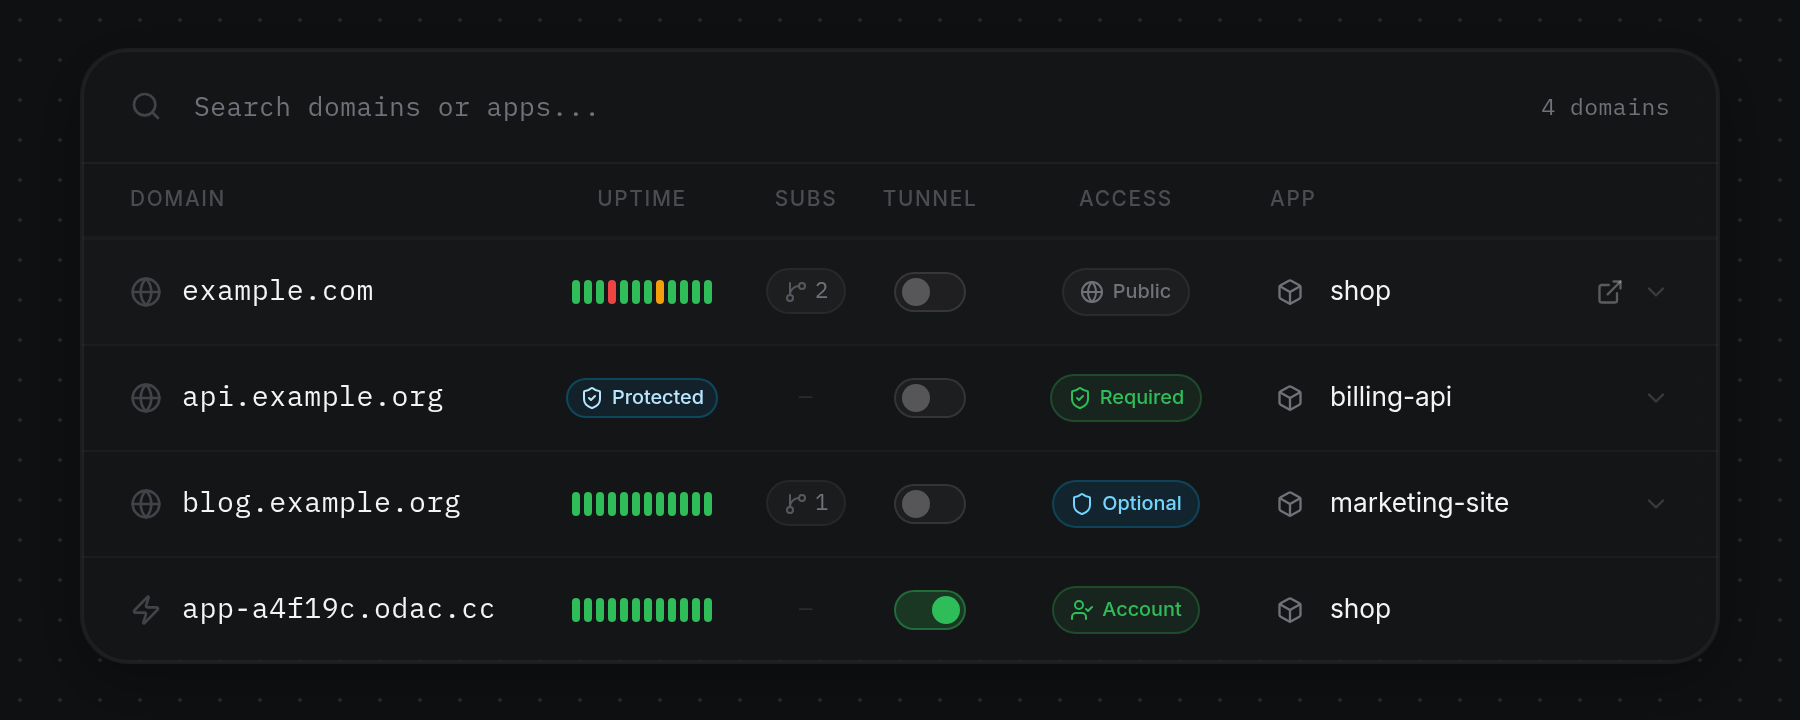
- Read the domains table column by column from left to right:
- Domain: Custom domains appear with a globe icon, and
.odac.cctunnels appear with a lightning icon. - Uptime: Shows a 12-bar strip covering the last 24 hours in 2-hour windows from left (oldest) to right (most recent). Green bars mean
Up, amber bars meanDegraded, red bars meanDown, and dim gray bars meanNo data. Hover over any bar to read its status, time window, and check count. If a custom domain's Access mode is Required, ODAC pauses checks and shows a blue Protected badge instead. - Subs: Shows
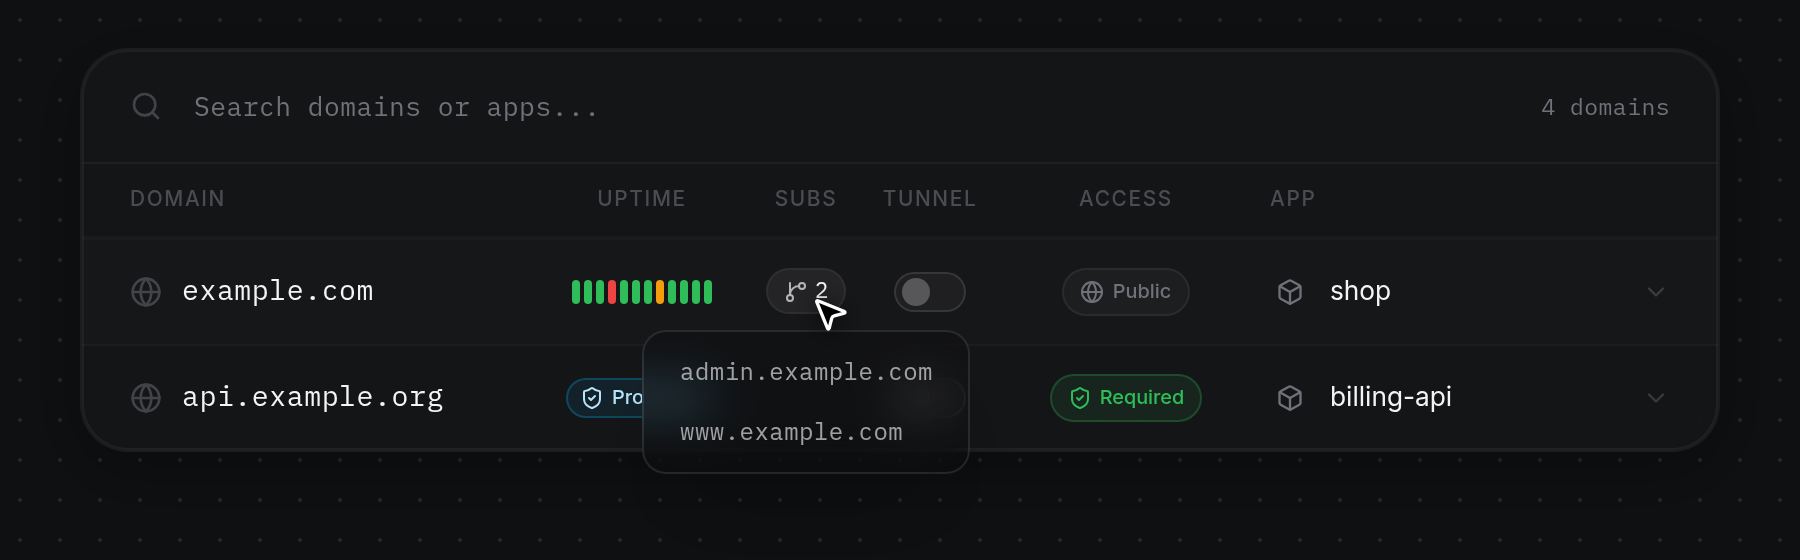
—when no subdomains are attached, or a branch badge with the number of subdomains. - Tunnel: A read-only status switch. It is green and active on
.odac.cctunnels and off on custom domains. Hover over the switch for status details (clicking it showsThis is a status indicator, not a setting. It cannot be changed during beta.). - Access: Displays the visitor access badge: Public, Optional, Required, or Mixed for custom domains, and Account or Account / Cert for
.odac.cctunnels. Click any badge to configure access rules (see Protect a domain with client certificates and Tunnel sign-in and device certificates). - App: Shows the attached app's name, or
unassignedif no app is linked. - Hover over a row to reveal the external link icon on the right to open the address in a new browser tab. Custom domain rows also show a downward chevron indicating the row expands.
- Domain: Custom domains appear with a globe icon, and
- Hover over a Subs count badge to open a popover listing every attached subdomain in alphabetical order, where you can select any hostname to copy it.
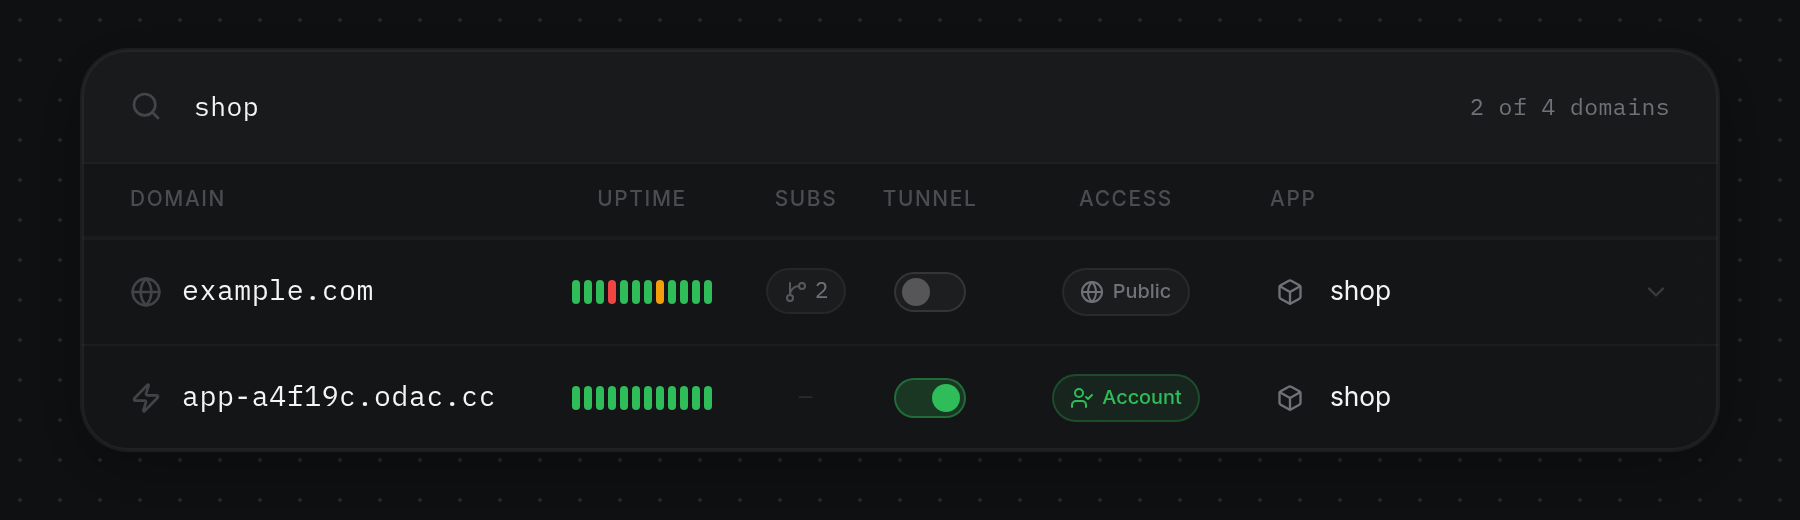
- Click the Search domains or apps... field at the top of the card and type a domain name, subdomain, or app name. The list filters as you type, collapses any expanded row, and updates the counter on the right (such as 2 of 4 domains).
Expand a domain to view uptime and SSL
- Click any custom domain row (outside its Subs badge, Tunnel switch, Access badge, or external link icon) to collapse the other rows out of view and expand its uptime panel. Clicking a
.odac.cctunnel row opens its Access settings instead. Inside the expanded panel, review:- Summary tiles: Status (
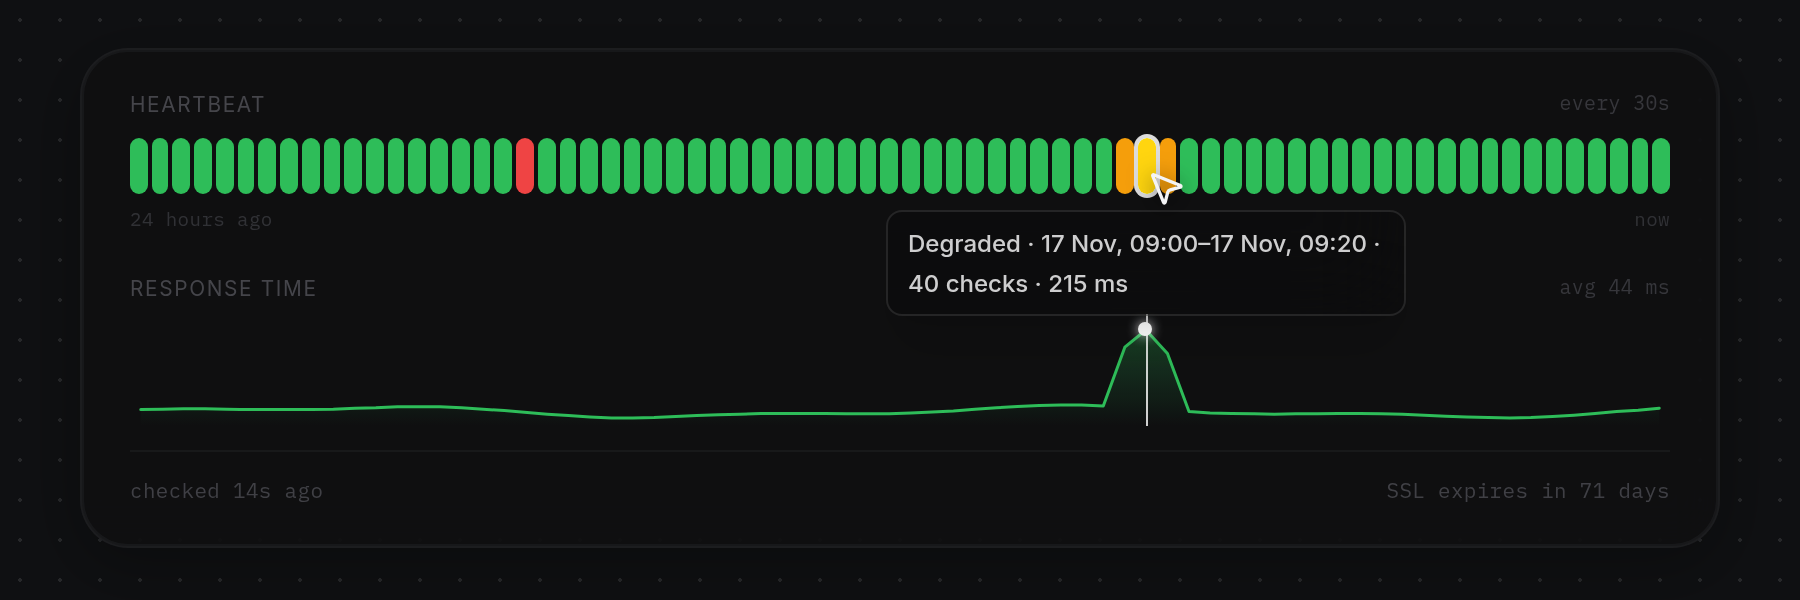
Up,Degraded,Down,Paused, orNo data, plus how long it has held that state), Uptime 24h and Uptime 30d percentages (—when no history exists yet; green at 99.9% or higher, amber from 99% to 99.89%, red below 99%), and Response showing the 24-hour average latency and min to max range. If Access is Required, the panel shows the Protected badge and notes that monitoring is paused while client certificates are required. - Heartbeat: Displays the check interval on the right (such as every 30s) and a strip of bars from
24 hours agoon the left tonowon the right. - Response time: Displays the 24-hour average on the right (such as avg 44 ms) and an area line chart aligned to the same 24-hour windows as Heartbeat (or
No response datawhen fewer than two measurements exist). - Recent events: Lists up to four recent status transitions with colored dots, event notes, and relative timestamps when status changes have been recorded.
- Footer: Shows when the domain was last checked on the left (such as checked 14s ago) and the certificate status on the right (
SSL expires infollowed by days remaining, turning red when fewer than 10 days remain, orSSL expiredin red if expired).
- Summary tiles: Status (
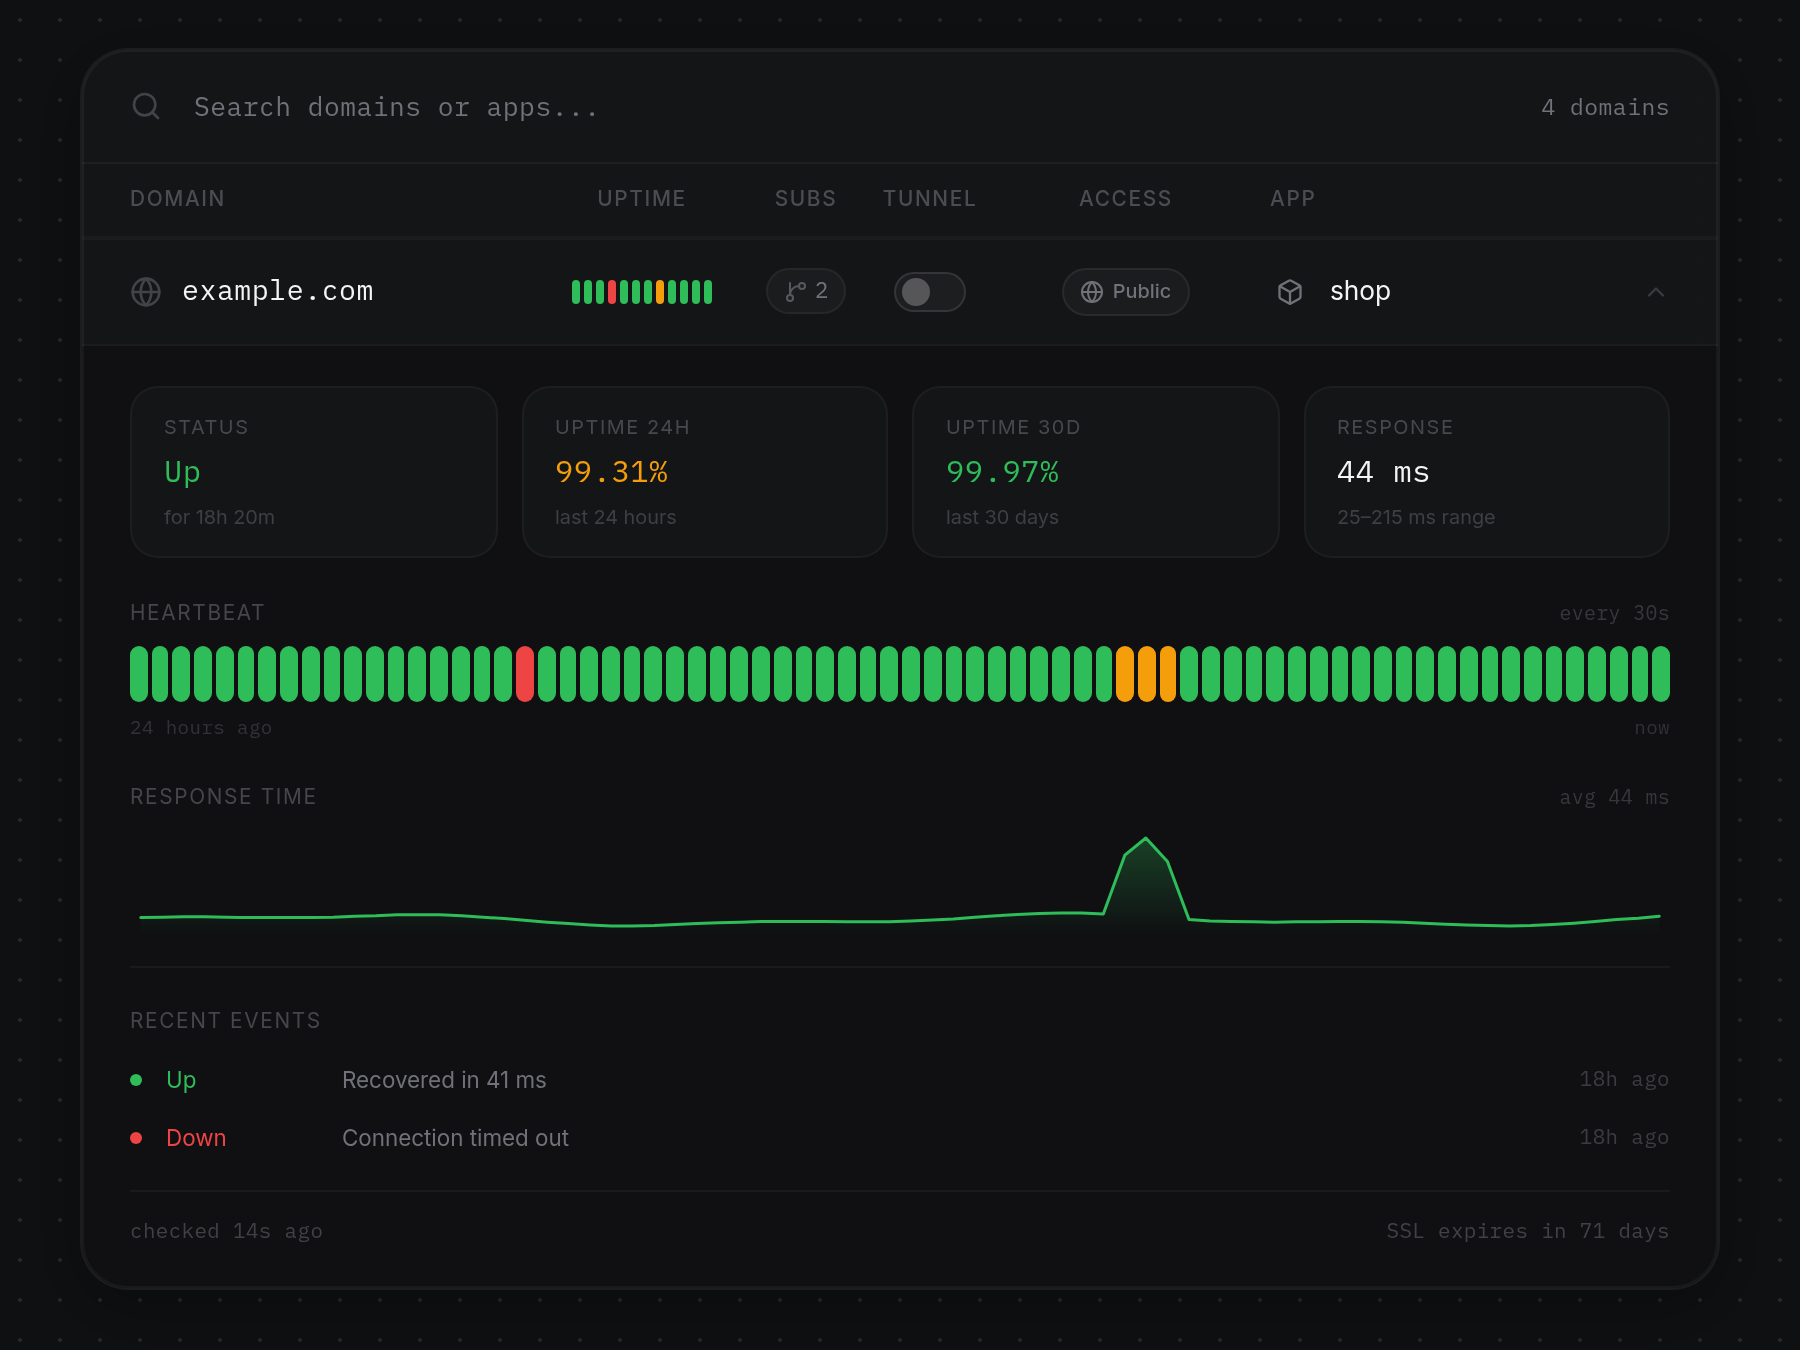
- Hover over any Heartbeat bar or any point along the Response time chart. Both views highlight the exact same time window together: the matching Heartbeat bar lights up with a white outline, a vertical white crosshair line and glowing dot drop onto the Response time curve, and a tooltip displays the status, time range, check count, and latency for that window. Click the domain row again (or its rotated chevron) to collapse the panel and return to the full list.