Read build and runtime logs
Inspect recent build outcomes, container health checks, and live log streams in the right-hand app inspector on app.odac.run. From System Status, you can expand Build Logs or Runtime Logs into a streaming console, or jump straight to Build Logs by clicking a building app card on the Canvas.
Read the System Status summary
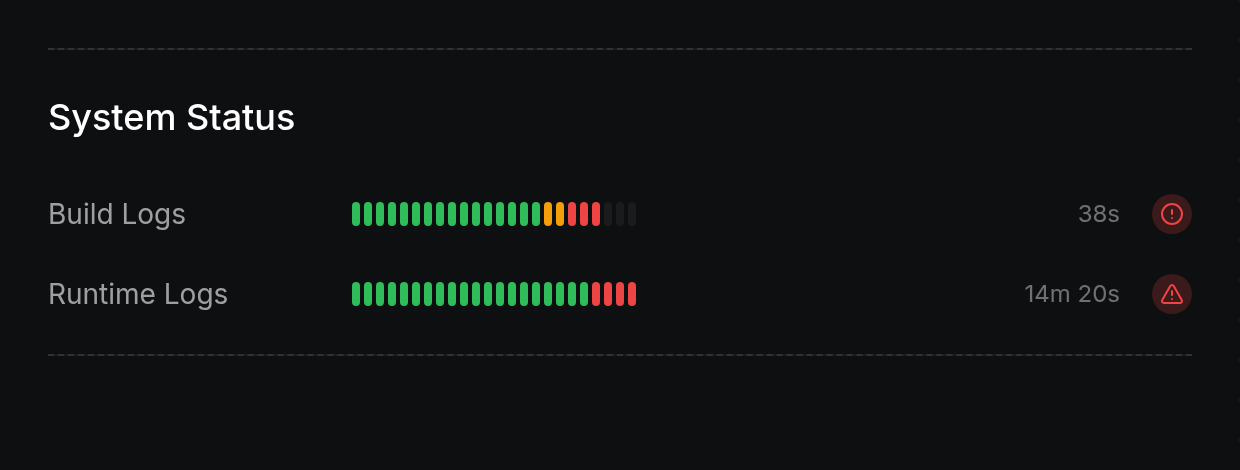
- Open an app's inspector drawer from the Canvas (see Inspect, rename, restart, and delete an app) and scroll to System Status. Read the Build Logs row (shown for apps with build history or an active build) from left to right: up to 24 vertical bars show recent build phases (green for passed, amber for warnings, red for errors, and faint gray when no phase data is recorded), followed by the build duration (42s, 1m 42s, or
-when unavailable) and a status icon on the right. A green checkmark indicates a successful build even if individual phase bars show warnings or errors, a spinning white loader indicates an active build or deployment, and a red alert icon indicates a failed build.
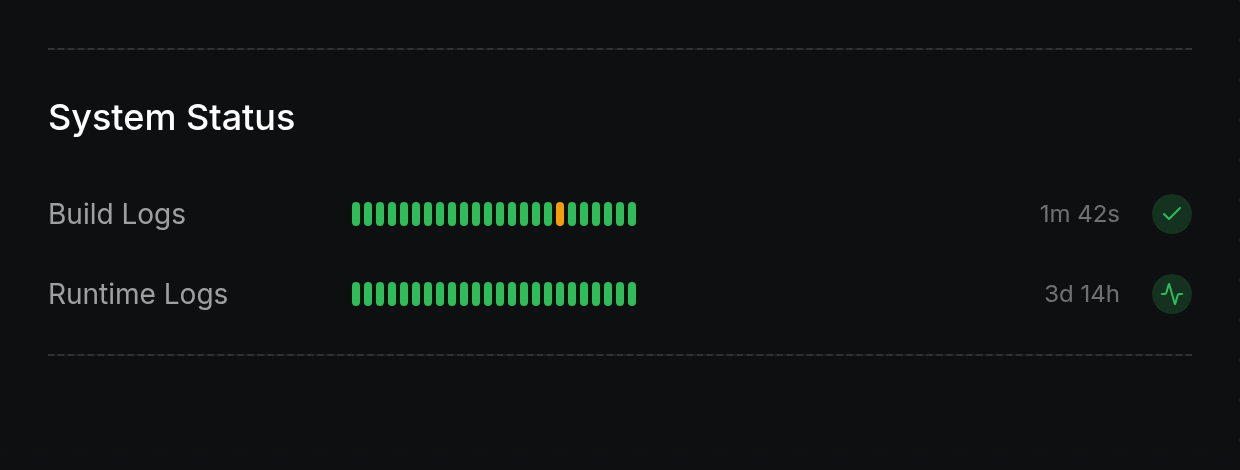
- Read the Runtime Logs row below Build Logs (shown once health check data is available) to check container health and uptime. Up to 24 vertical bars display recent health checks (green when healthy, red when failing), followed by the container uptime (3d 14h, 4h 12m, 18m 5s,
25s, orJust now) and a status icon on the right: a green pulse icon while running, a spinning amber loader while starting, restarting, or redeploying, or a red warning triangle when the container exited or hit an error. If an app has neither build history nor runtime health data, System Status stays hidden.
Open the live Build Logs terminal
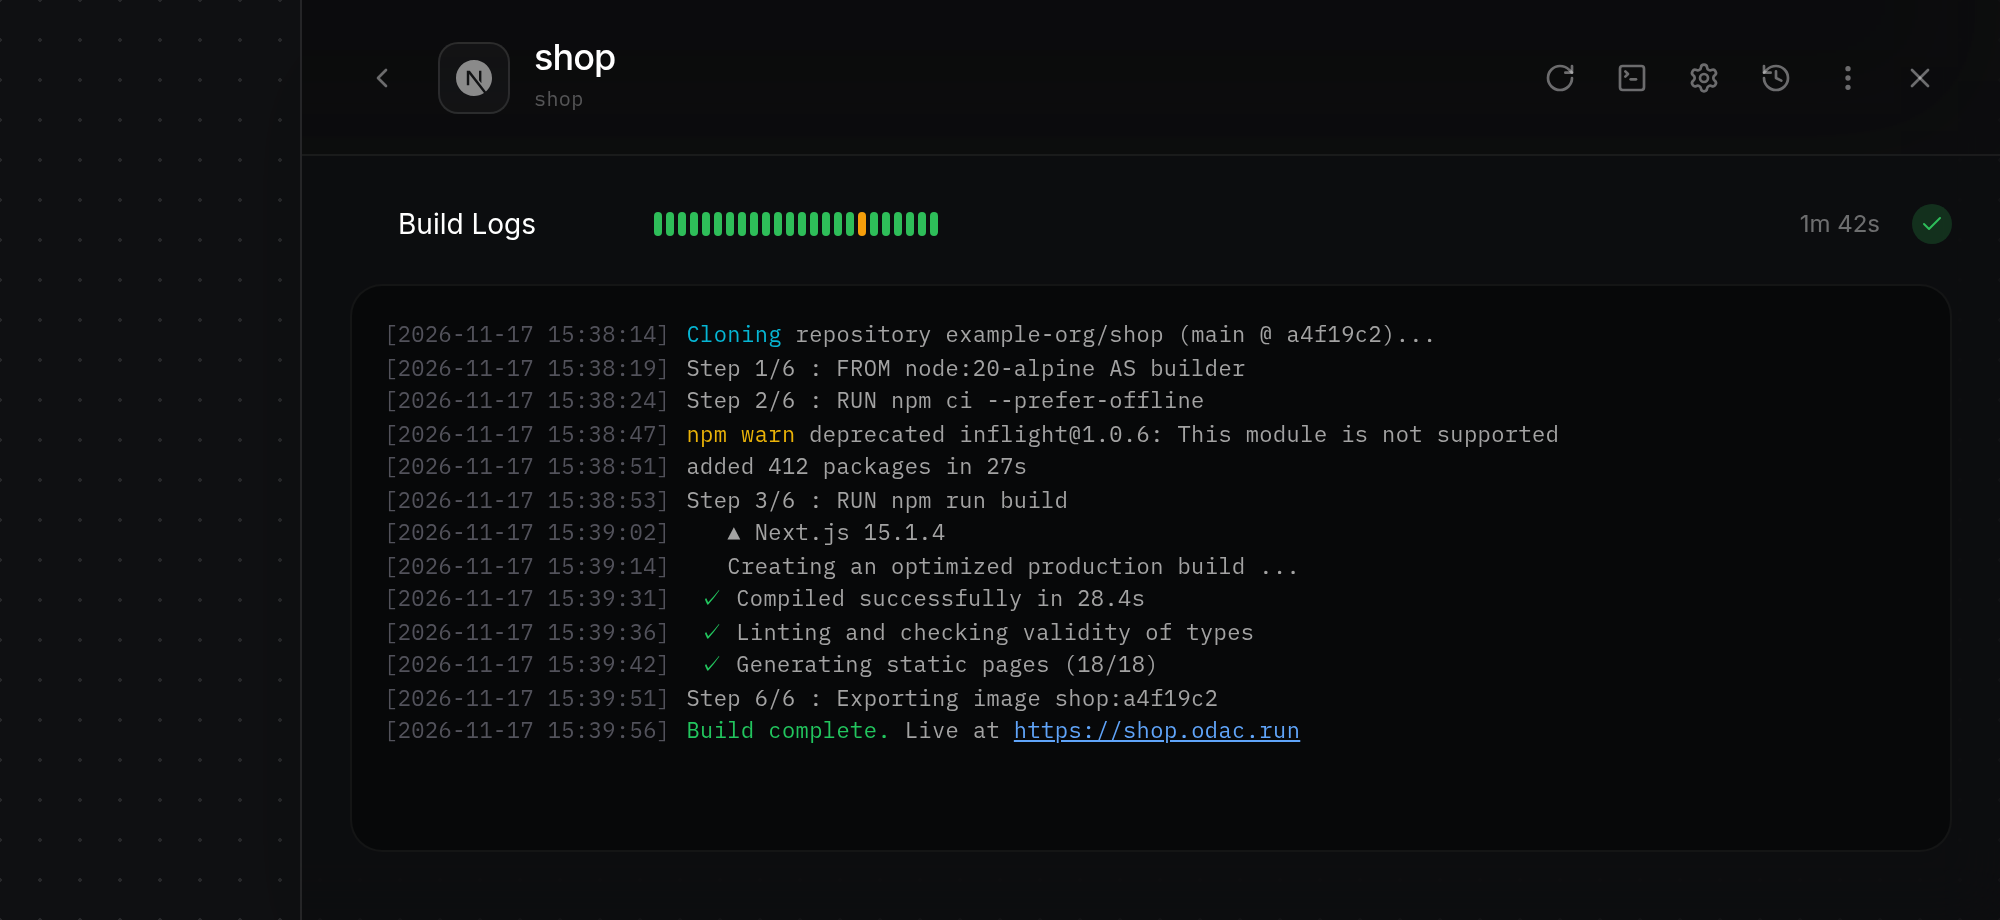
- Click the Build Logs row in System Status. The inspector drawer widens, collapses all other sections out of view, indents the Build Logs label, and opens the log terminal below it. While logs load,
Fetching build logs...appears briefly, followed by timestamped lines ([YYYY-MM-DD HH:mm:ss]) with terminal colors and clickable links. Active builds stream new lines to the bottom automatically; finished builds display the complete build output.
Open the live Runtime Logs terminal
- Click the Runtime Logs row in System Status to widen the inspector drawer and start streaming live container output. After
Fetching realtime logs...clears, ODAC appends timestamped lines ([YYYY-MM-DD HH:mm:ss]) as the container writes them, highlighting error output in red and keeping the terminal scrolled to the newest lines.
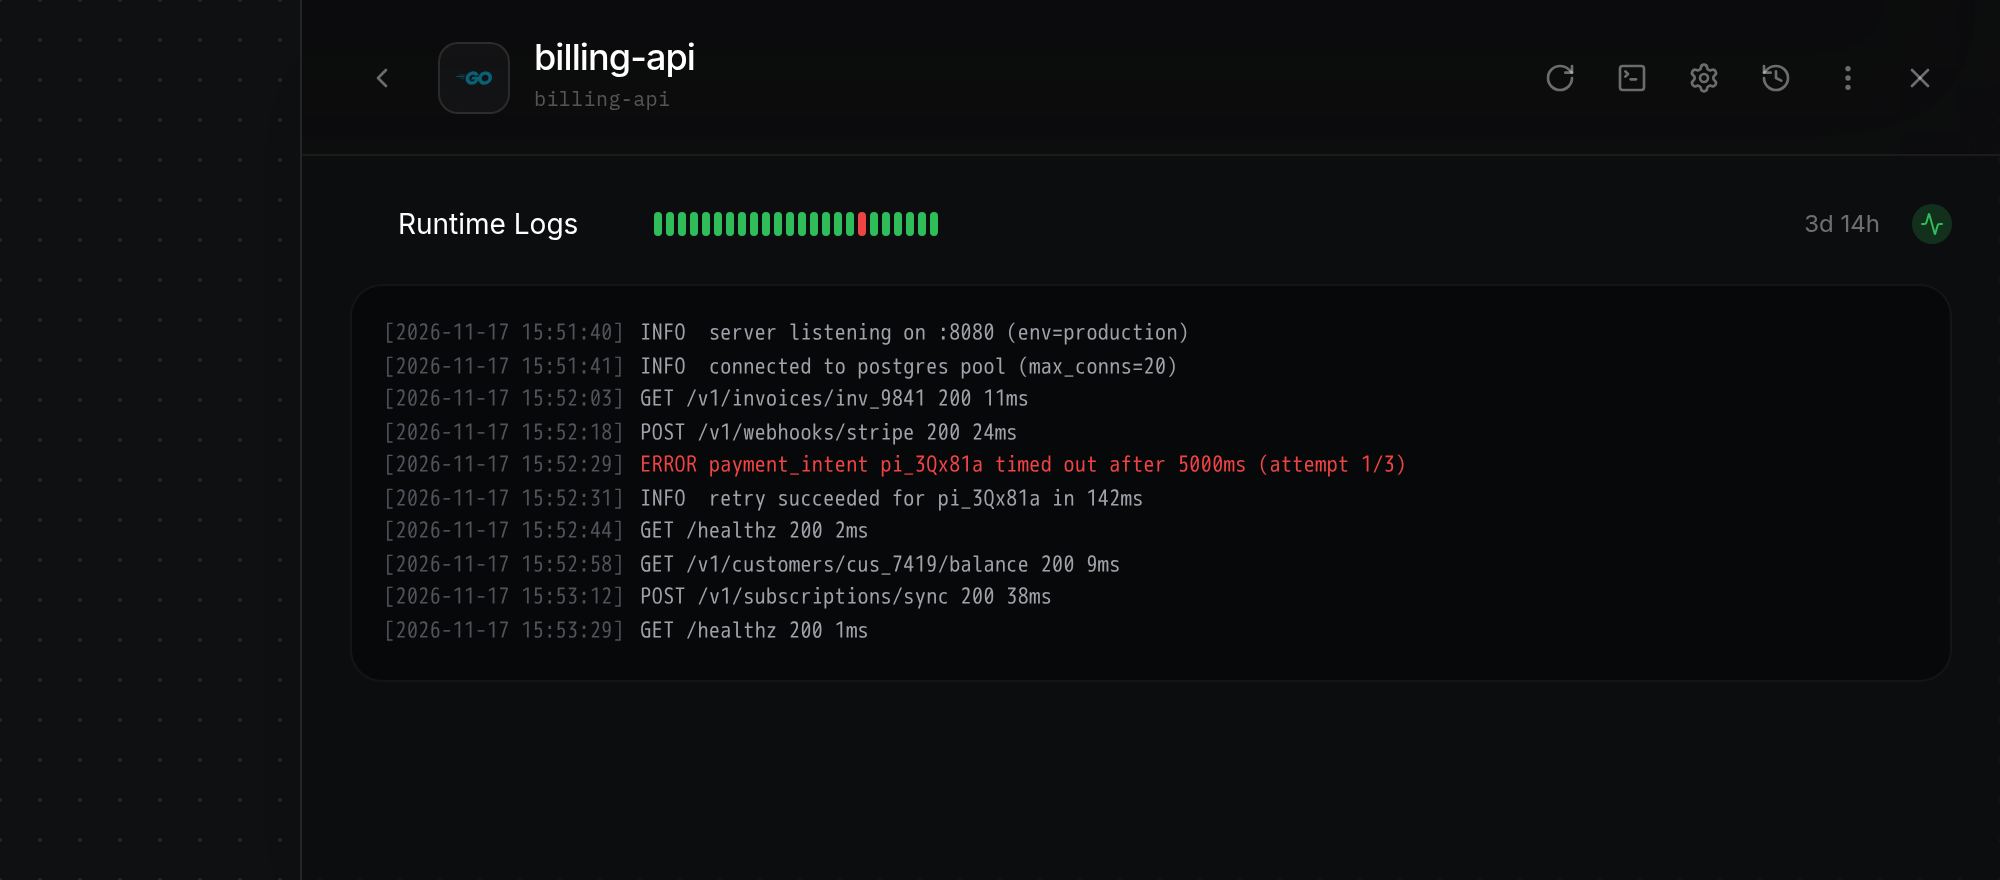
Jump to Build Logs from a building card
- When an app is creating, installing, or redeploying on the Canvas, its card appears dimmed with a spinner and
Creating...,Installing..., orRedeploying.... After the brief two-second placement pause on a new card, click the building card to open the inspector drawer directly into the expanded Build Logs terminal.
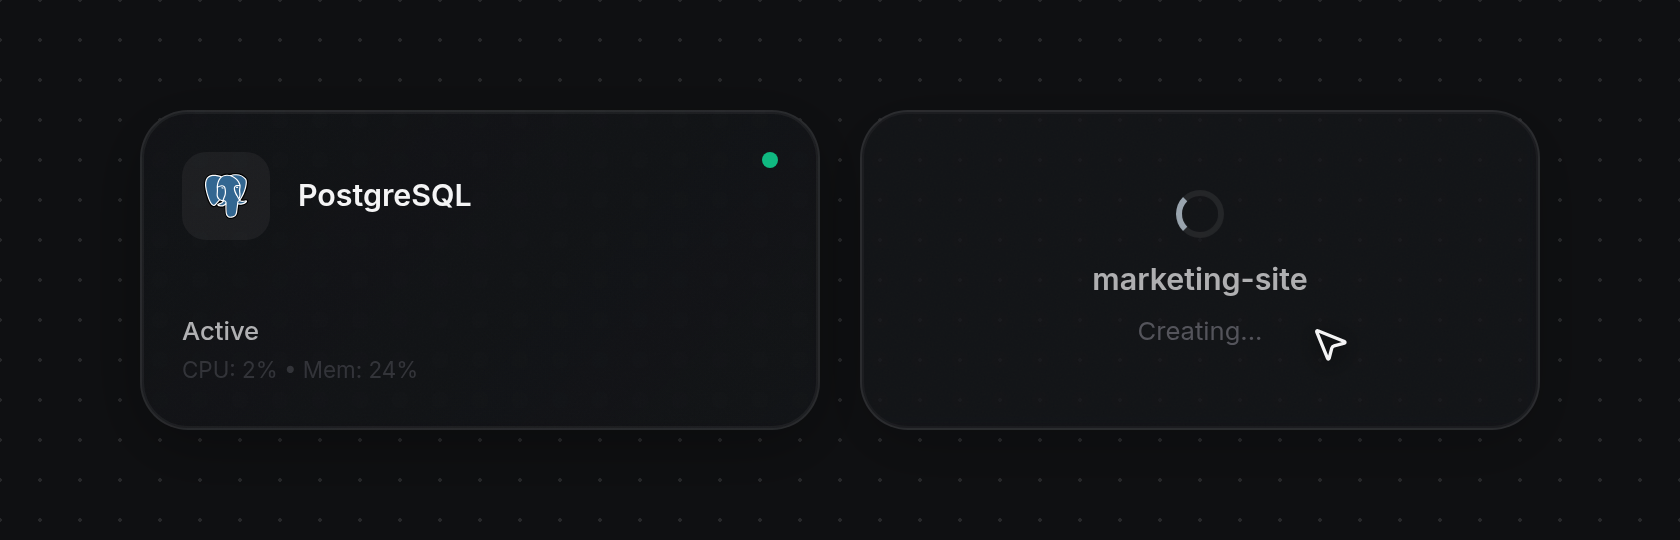
Return to the inspector overview
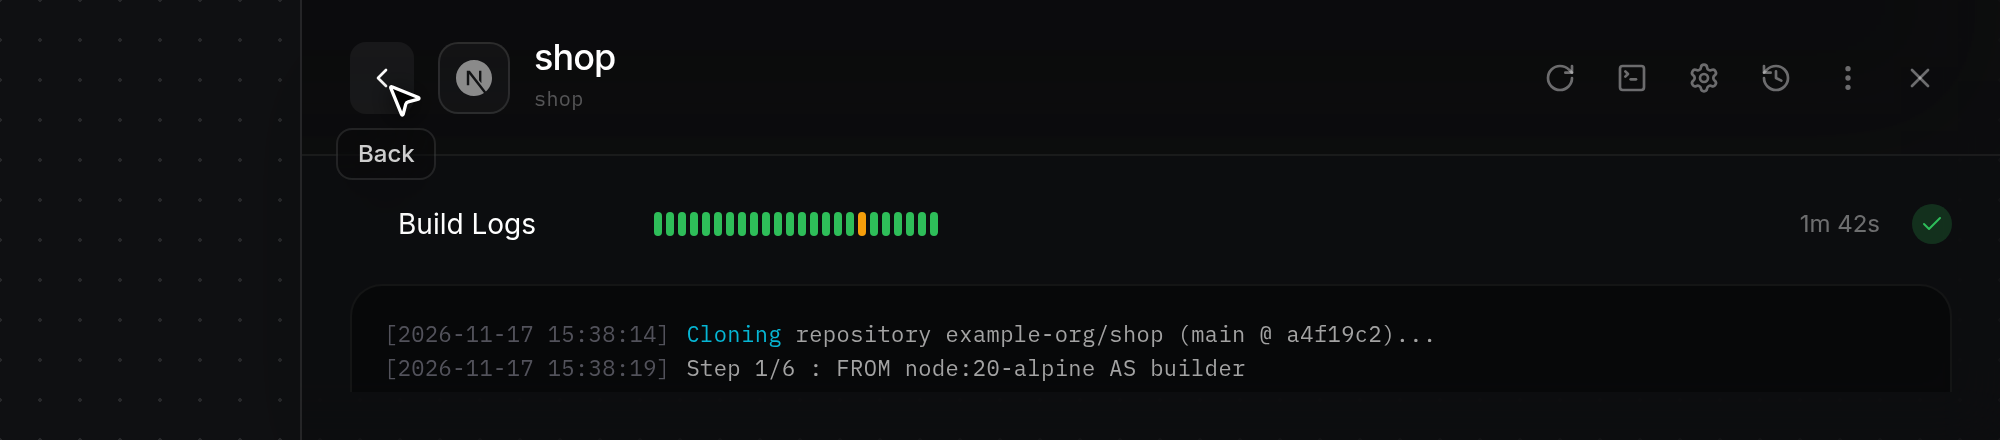
- Click the left-chevron Back button on the left side of the inspector header (or click the expanded Build Logs or Runtime Logs row again) to stop the active log stream, return the drawer to its standard width, and bring back the rest of the app inspector. Click Close (
×) or empty Canvas space to dismiss the drawer completely and stop any active log stream.